It has been observed that sometimes a client that is not seen very often will have a rush of tickets submitted in a brief period of time. I was looking through aggregate ticket data the other day, and the thought occurred to me that there might be a chance I could predict request surges that are sometimes seen with certain clients. I went through our ticket system and found a client that might serve as a good example case for this and started analyzing the data.
I first tried to take a look at the client’s ticket submission history over time:
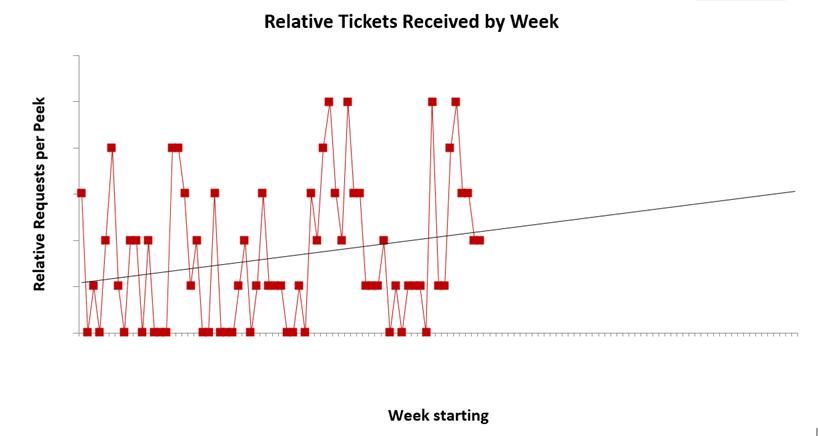
The figure does a good job of showing what issues surges are, and it shows how the request volume from this example client is increasing over time. While it’s interesting to note that the request volume is going up, it doesn’t really help us predict issue surges.
Maybe requests surges have something to do with what day of the week it is, so I teased that data out:
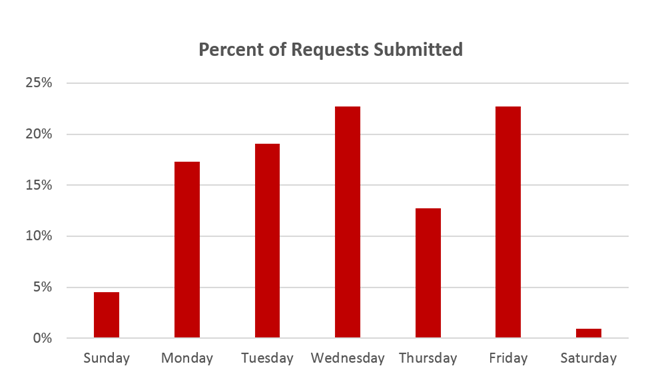
There is a little bit of a peak on Fridays, but the amount isn’t really significant here. I thought of one more place to look; request volume by day of the month:
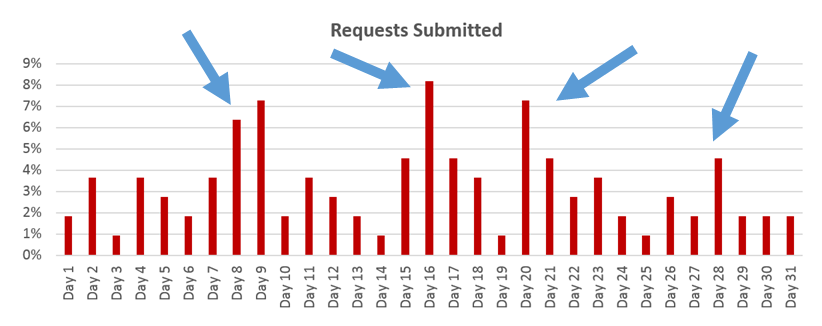
This is exactly what I was looking for. We see a few islands of higher than normal request submission. It turns out that for this client, these dates happen to be near repeating deadlines.
Using this data is very helpful. Combining this information with other tools, we know where certain ticket surge hot spots might be, and can plan accordingly to have extra personnel to handle it.