In the world of information technology it is often the case that managers will find the need to rely on groups outside of their immediate control for escalations of issues or the fulfillment of projects. Managers who find themselves relying on such outside groups often find themselves seeing familiar trend – projects taken on by these groups are virtually universally fulfilled late.
The causes of this pattern include the planning fallacy, optimism bias, and a number of other phenomenon discussed elsewhere. In many cases, project delays can be minimized in areas under a manager’s direct control using a number of methods. But, what options are available to reduce project fulfillment delays for areas that are not under direct influence?
Before we can solve the problem, we must first describe it.
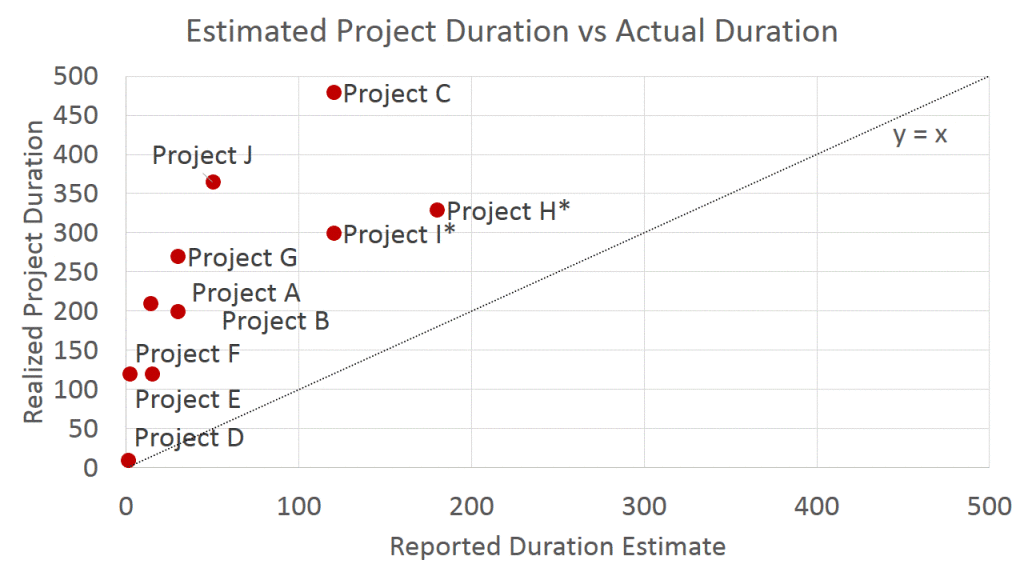
I went through my notes for the past few years and gathered a number of relevant projects and initiatives where the primary responsibility and fulfillment ability rested on an outside group. With this data set, I collected two pieces of information: (1) How long did the outside group say the project would take during the planning phase?, and (2) How long did the project actually take?. My anonymized data is below:
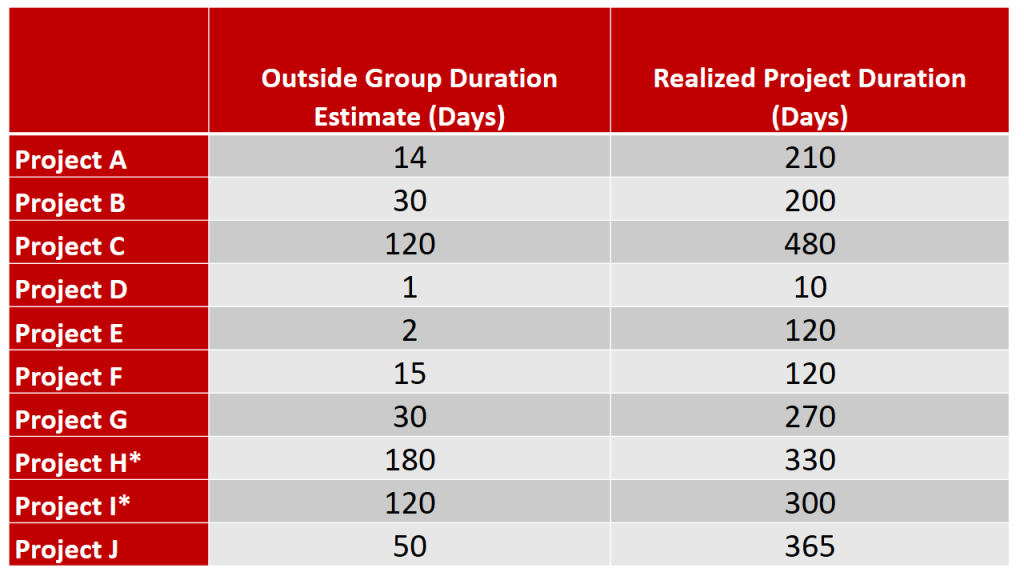 (The asterisks will be discussed in another post)
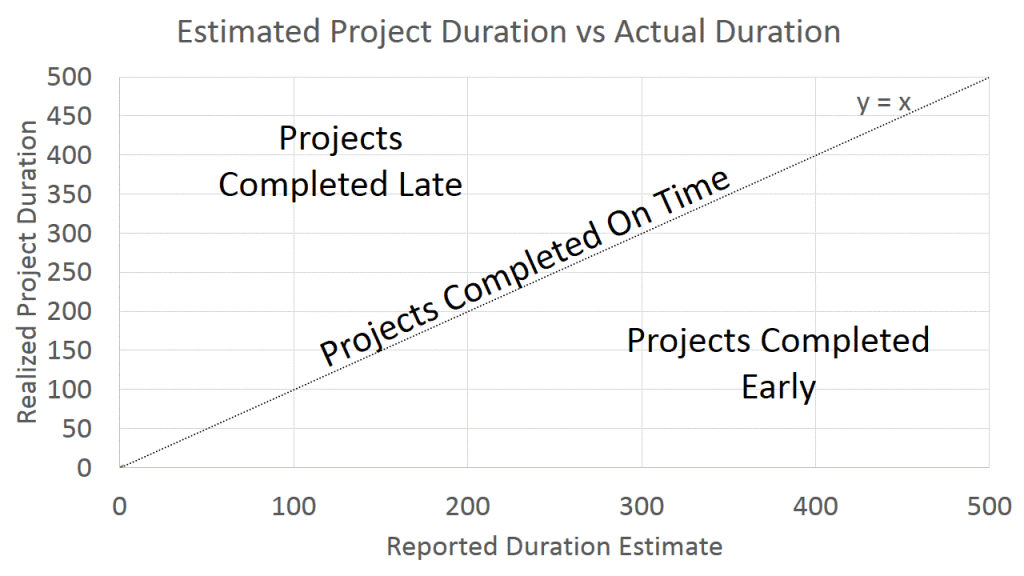
I explored some options that might work for visualizing the data. Eventually I decided on a simple graph with the initial reported duration on the x axis, and the realized duration on the y axis. Any point on the line of y = x would be a project delivered in the exact time estimated by the outside group.
Any point below the y=x line would be a project delivered early, and any point above the line would be a project delivered late. So, let’s take a look at the data:
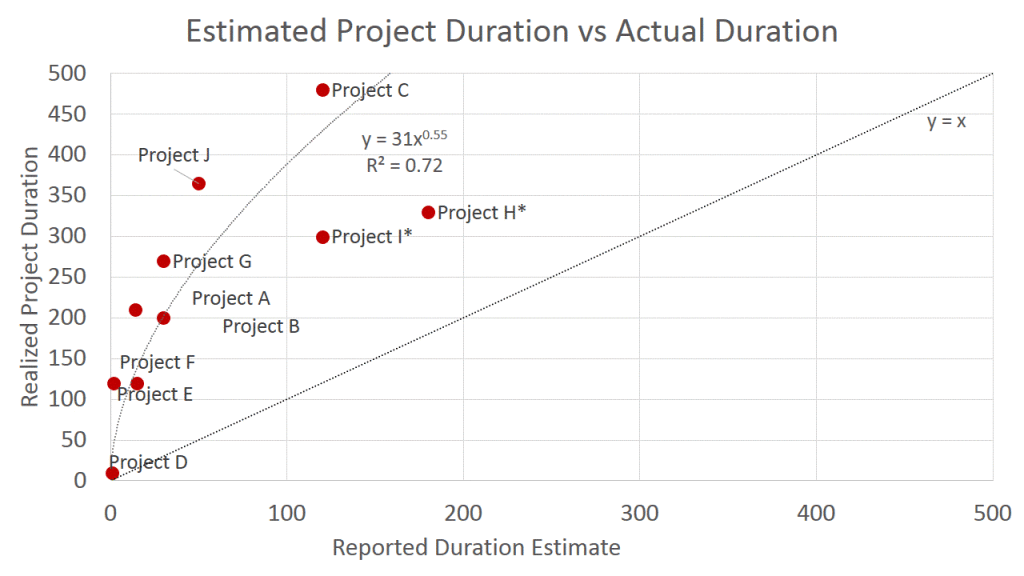
It is easy to see here projects delivered by outside groups have a strong tendency to be late. It is also interesting to note the clustering of the data. The delay isn’t random, and it isn’t linear.
I tried few models with the data, and found that the power function to be the most significant, with an R2 of 0.72. A logarithmic fit had a comparable R2, but the fact that it predicts projects will be completed early as project lengths increase suggests it is not a good model for this discussion (the power model also predicts projects will be delivered early, but only for projects with an extremely long estimated duration of 5 or 6 years, as opposed to the crossover of about 1.2 years for the log model)
So, with the model, we can estimate realized project duration of groups I frequently work with, with a good degree of accuracy as:
and
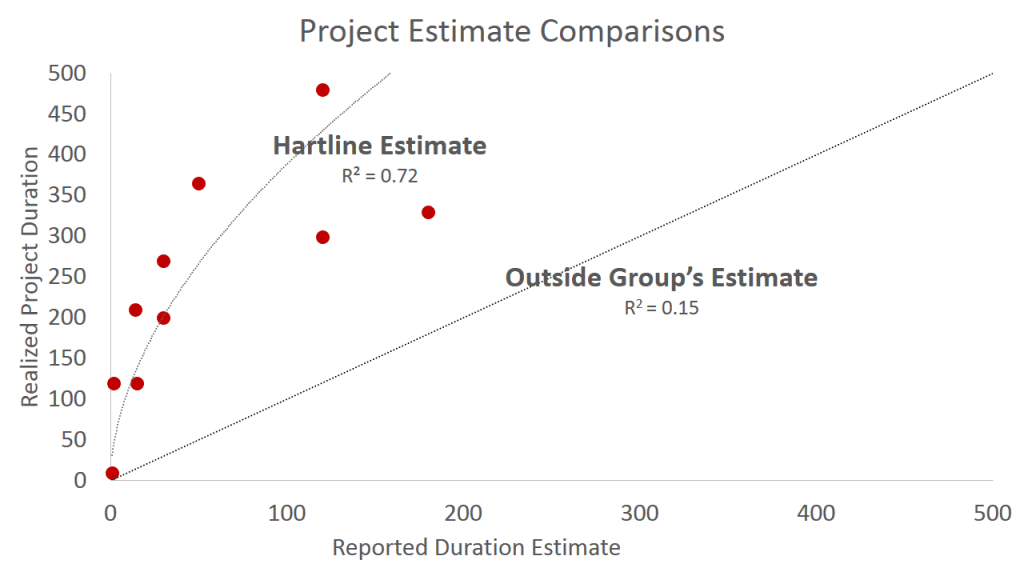
If the outside groups estimate were perfectly accurate, all the data would fall on the y = x line. Given this, we can prepare a number to represent the variation of the outside group estimate from the realized duration by comparing the groups model (y = x) with the realized data – that is calculating an R2 using the same data points but with a y = x linear model. I get an R2 of 0.15.
We can then compare the two models to see which has more predictive power. The realized project duration model, we see an R2 of 0.72 – rather good for human data of this type. With the R2 of the outside group’s predictions being 0.15, it is obvious that that the realized project duration model has much more predictive power. It is likely that the specific numbers discussed here are accurate for the authors scope, but the principle discussed here is likely true in many other areas.
The preverbal battle to reduce project delays is one that has been fought from antiquity. Obviously, it would be best if project delays didn’t exist and concept discussed isn’t meant to be a replacement for a manager working to reduce project delays outside of the scope of their direct influence. It is useful for a manager to have a tool such as the project delay estimate ready so as to minimize resources expended on projects.
Assuming projects outside of a manager’s direct influence will be late can counterintuitively allow projects to be completed more quickly. In the complex landscape of information technology, projects and initiatives often have dependency on other projects and initiatives. These project dependencies are often on projects outside of a manager’s direct control. If a manager uses the realization estimate model described here, they will minimize the chance of time overruns on a project that their project depends on effecting the timeliness of their project of interest. Applying the concepts discussed here is an effective tool for IT managers to minimize the propagation of project delays into projects under their control, in addition to maximizing the use of resources and effectively managing expectations.
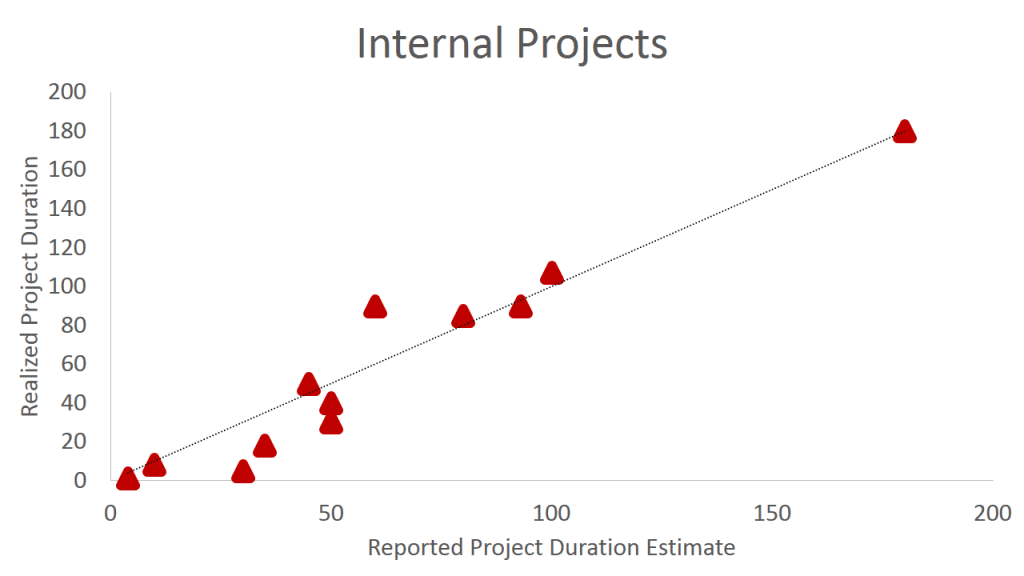
End note: I have had some requests to compare the above with internal projects. Below are projects sampled from the same time range. It is clear how different these two sets of data are.
