Efficient management of an IT Help Center often involves a regime of support tiers, with Tier 1 being the beginning tier. Tier 1 usually escalates any issues it can’t address due to training or other reasons to Tier 2, who then may address it or pass it to the next tier. When managing a Help Center, managers should make an effort to minimize support costs, and one of the ways to minimize support costs from the HR side is to effectively titrate what percent of requests Tier 1 should resolve, and what remainder should be escalated.
Generally, individuals in Tier 2 have been in the industry longer, and have more training and experience. The per man hour human resource cost of Tier 2 is generally significantly higher than the Tier 1 cost. In most Help Center settings, the Tier 1 personnel are high turnover individuals, such as student workers in the academic setting or interns in other industries. Because of this high turnover, it is difficult for Tier 1 individuals to address complex issues that require a high degree of networking or experience.
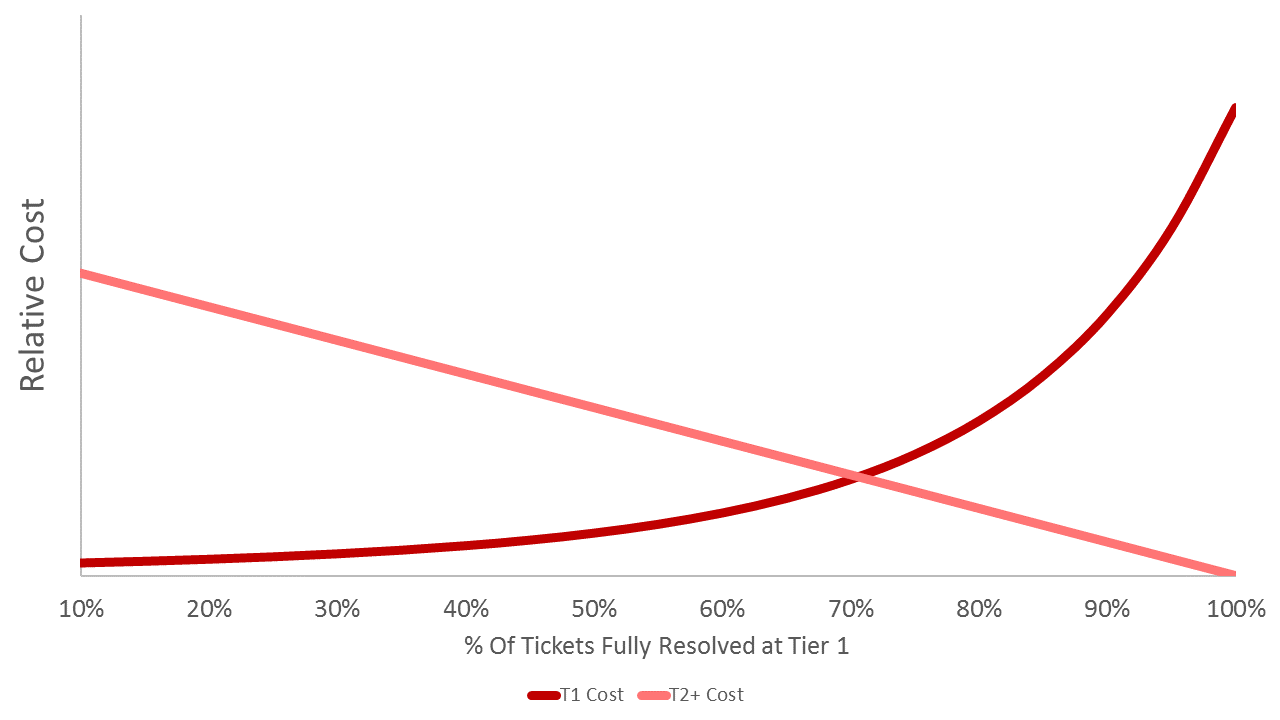
This means, as we ask Tier 1 to fully resolve a higher and higher percentage of requests, the amount of time required to resolve the average request grows exponentially – due to the complex nature of the higher perverbial fruit and the experience that is limited in Tier 1 relative to Tier 2 and higher (Tier 2+). This additional time translates directly into additional cost.
Oppositely, the higher experience level, training, and professional network of higher tiers means that the cost of resolving a greater portion of incoming requests increases in a way that can better be modeled in a linear fashion.
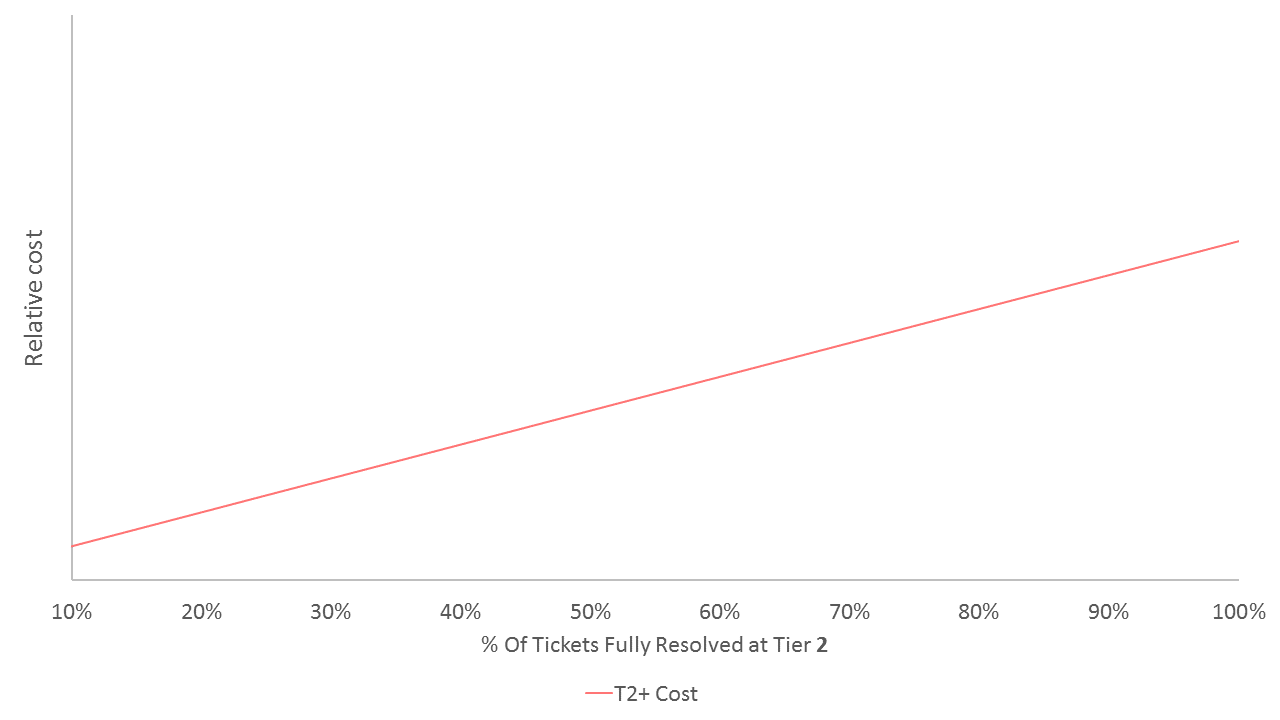
We can combine these two observations into one graph, where the X axis is the percentage of requests resolved by Tier 1 (and the remaining requests are resolved by Tier 2+).
This means that the total support cost can be found by adding the two levels, Tier 1 and Tier 2+.
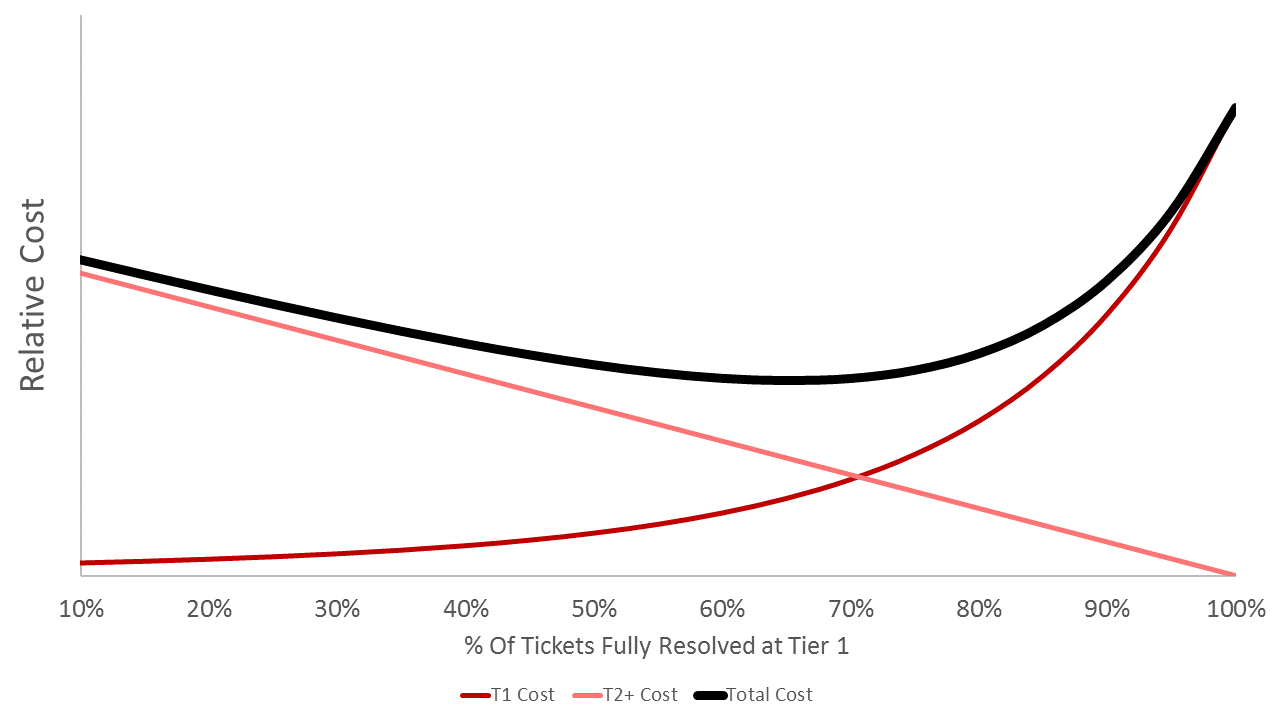
This chart tells us an interesting story. There is a goal percentage of requests that Tier 1 should handle that will minimize costs. Also, it is not intuitive what this percentage is, it is not necessarily simply the requests that start taking more time.
The exact percentage shown here does not necessarily reflect the percentage needed for the authors environment, and it is likely that this percentage would differ among help center environments.