WDFW publishes stocking reports, though I have found the page a little difficult to use. One can input species, lakes, and other data and receive a table of stocking information for a time range. Sometimes, I just want to know if there has been any stocking near my house, or maybe where I am planning to go camping. I decided I wanted to build my own stocking report map to solve the problem. It’s been cold and rainy lately, so I thought this could be a good project to work on while I spend time indoors.
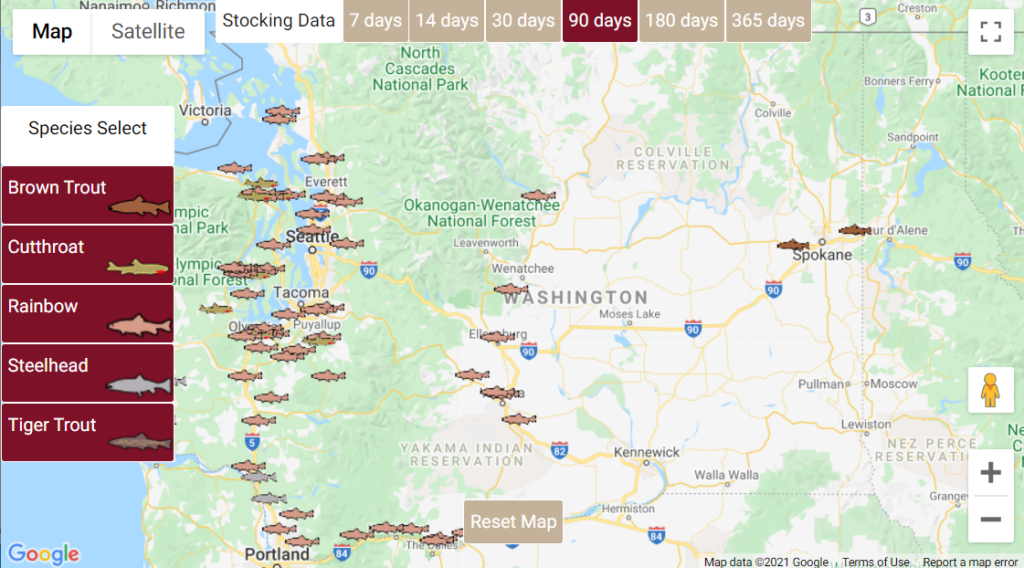
Figure out how to collect the stocking data
I decided to go with python to do the meat of the work in getting the data. The library BeautifulSoup looked like a good choice for the initial work of grabbing the data. The data is public record, easily accessible, and requires no credentials. It seemed like the perfect type of data to access for a project like this. With less than 100 lines of code, I was able to build a 2D array of each lake, county, stock date, species, number, fish per pound, hatchery, and other notes for each stocking report.
#pass the current stoc
def extract_stocking_data(current_lake,stocking_data):
###print(current_lake)
current_lake = current_lake[current_lake.find(“lake_stocked”)+13:len(current_lake)]
lake_name = current_lake[0:current_lake.find(‘>’)-1]
try:
lake_name = lake_name[0:lake_name.find(‘(‘)-1]
except: #lakes w/o a counti in their name, national parks i think, will error here. Ignore
pass
current_lake = current_lake[current_lake.find(“?county=”)+1:len(current_lake)]
county_name = current_lake[current_lake.find(“?county=”)+8:current_lake.find(‘?county=’)+30]
county_name = county_name[0:county_name.find(‘”>’)]
current_lake = current_lake[current_lake.find(‘?county=’)+30:len(current_lake)]
current_lake = current_lake[current_lake.find(‘?region=’)+30:len(current_lake)] #skip region
######print(current_lake)
stock_date = current_lake[current_lake.find(‘headers=”view-stock-date-table-column”>’)+39:current_lake.find(“</td>”)-10]
current_lake = current_lake[current_lake.find(‘?species=’)+0:len(current_lake)]
species = current_lake[current_lake.find(‘”>’)+2:current_lake.find(“</td>”)-5]
current_lake = current_lake[current_lake.find(‘views-field views-field-num-fish’)+0:len(current_lake)]
number_of_fish = current_lake[current_lake.find(‘fish-table-column”>’)+19:
+———-current_lake.find(“</td>”)-10]
current_lake = current_lake[current_lake.find(‘views-field views-field-fish-per-lb”‘)+0:len(current_lake)]
fish_per_lb = current_lake[current_lake.find(‘view-fish-per-lb-table-column”>’)+31:current_lake.find(“</td>”)-10]
current_lake = current_lake[current_lake.find(‘views-field views-field-hatchery’)+0:len(current_lake)]
hatchery = current_lake[current_lake.find(‘view-hatchery-table-column’)+106:current_lake.find(“</td>”)-5]
try:
if(hatchery.find(‘”>’)>-1):
hatchery = hatchery[hatchery.find(‘”>’)+2:len(hatchery)]
except:
pass
current_lake = current_lake[current_lake.find(‘views-field views-field-other-notes’)+0:len(current_lake)]
other_notes = current_lake[current_lake.find(‘view-other-notes-table-column”>’)+31:current_lake.find(“</td>”)-10]
#figure out days since the stocking
days_since_stocking = 9999 #default to error
datetime_str = str(stock_date)
datetime_object = datetime.strptime(datetime_str,”%b %d, %Y”)
##print(datetime_object)
now = datetime.now()
##print(now)
days_since_stocking = int((now – datetime_object).days)
##print(days_since_stocking)
if(1==1):
do = ‘nothing’
##print(current_lake)
print(“————————–“)
#time.sleep(0.1)
print(“Lake: “+str(lake_name))
#time.sleep(0.1)
print(“County: “+str(county_name))
#time.sleep(0.1)
print(“Stock Date: “+str(stock_date))
#time.sleep(0.1)
print(“Species: “+str(species))
#time.sleep(0.1)
print(“Number: “+str(number_of_fish))
#time.sleep(0.1)
print(“Fish per lb: “+str(fish_per_lb))
#time.sleep(0.1)
print(“Hatchery: “+str(hatchery))
#time.sleep(0.1)
print(“Other notes: “+str(other_notes))
#time.sleep(0.1)
## print(“Days since stocking: “+str(days_since_stocking))
print(“————————–“)
#time.sleep(0.2)
stocking_data.append([lake_name,county_name,stock_date,species,number_of_fish,fish_per_lb,hatchery,other_notes,days_since_stocking])
return(stocking_data)
###download this year’s results
URL = ‘https://wdfw.wa.gov/fishing/reports/stocking/trout-plants/all?lake_stocked=&county=&species=&hatchery=®ion=&items_per_page=All’
page = requests.get(URL)
soup = BeautifulSoup(page.content, ‘html.parser’)
results = soup.find(‘tbody’)
results = results.find_all(‘tr’)
stocking_data = []
stocking_data.append([“Lake”,”County”,”Stock Date”,”species”,”Number”,”Fish per lb”,”Hatchery”,”Other Notes”,”Days Since Stocking”])
i = 0
while(i < len(results)):
current_lake = str(results[i])
stocking_data = extract_stocking_data(current_lake,stocking_data)
i=i+1
##add last years results
#URL = ‘https://wdfw.wa.gov/fishing/reports/stocking/trout-plants/all?lake_stocked=&county=&species=&hatchery=®ion=&items_per_page=All’
last_year = int(current_year_full) – 1
URL = ‘https://wdfw.wa.gov/fishing/reports/stocking/trout-plants/archive/’ +str(last_year)+’?lake_stocked=&county=&species=&hatchery=®ion=&items_per_page=All’
page = requests.get(URL)
soup = BeautifulSoup(page.content, ‘html.parser’)
results = soup.find(‘tbody’)
results = results.find_all(‘tr’)
i = 0
while(i < len(results)):
current_lake = str(results[i])
stocking_data = extract_stocking_data(current_lake,stocking_data)
i=i+1
The next step is to add GPS coordinates to the table for eventual use on a map. There are hundreds of data points here. I don’t want to look them up by hand. And, what if WDFW posts a new one?
Google offers a geocoding API that allows one to get GPS coordinates from a query. I got going with the Google cloud console to get an API key and configured it to be able to do geocoding. I created a function to take an input query and return some coordinates.
#gets GPS coordinates from a google maps text query
def get_coordinates(query):
#print(“Searching for coordinates for “+query)
#fix formatting of query; https://developers.google.com/maps/documentation/urls/url-encoding
i = 0
new_query = ”
while(i<len(query)):
if(query[i] == ‘ ‘):
new_query = new_query + ‘%20’
else:
new_query = new_query + query[i]
i = i + 1
query = new_query
lat = 47.0372339 ##errors to WA officer coord
lng = -122.8976293
long_name = ‘ERROR’
try:
#overview: https://developers.google.com/maps/documentation/geocoding/overview
#someurl =’https://maps.googleapis.com/maps/api/geocode/json?address=alder%20lake&key=’ + API_KEY
someurl =’https://maps.googleapis.com/maps/api/geocode/json?address=’ + query +’&key=’+API_KEY
response = requests.get(someurl)
######print(response.text)
json_response = response.json()
json_response = json_response[‘results’][0]
######print(json_response[‘geometry’][‘location’][‘lat’])
lat = json_response[‘geometry’][‘location’][‘lat’]
######print(json_response[‘geometry’][‘location’][‘lng’])
lng = json_response[‘geometry’][‘location’][‘lng’]
long_name = json_response[‘address_components’][0][‘long_name’]
except:
pass
return(lat,lng,long_name)
One problem, the WDFW data has names like TEE LK, CARRIE BLAKE PRK PD, and SWIFT RES. The Google geocoding API doesn’t like that. So, to get better results, I massage the query before passing it to the above function. For example, PD is changed to pond, and LK to lake. I also add in the county to the query.
#not known, search google
i = 1
while(i<len(stocking_data)):
j = 1
while(j<len(lake_coordinates)):
if(stocking_data[i][0] == lake_coordinates[j][0]): #we already have coordinates
j = len(lake_coordinates) #break
else:
if(j == len(lake_coordinates)-1):
query = stocking_data[i][0] + ‘ ‘ + stocking_data[i][1] + ‘ county washington’
#change LK to lake, PD to pond, etc, for a more accurate google search
if(query.find(‘ LK’)>-1):
new_query = query[0:query.find(‘ LK’)-0]
new_query = new_query + ‘ lake’
new_query = new_query + query[query.find(‘ LK’)+3:len(query)]
query = new_query
if(query.find(‘ PD’)>-1):
new_query = query[0:query.find(‘ PD’)-0]
new_query = new_query + ‘ pond’
new_query = new_query + query[query.find(‘ PD’)+3:len(query)]
query = new_query
if(query.find(‘ RES’)>-1):
new_query = query[0:query.find(‘ RES’)-0]
new_query = new_query + ‘ reservoir’
new_query = new_query + query[query.find(‘ RES’)+4:len(query)]
query = new_query
if(query.find(‘@’)>-1):
new_query = query[0:query.find(‘@’)-0]
new_query = new_query + ‘ at ‘
new_query = new_query + query[query.find(‘@’)+1:len(query)]
query = new_query
####print(query[0:3])
if(query[0:3] ==’LK ‘):
####print(‘LKLKLKLKKKKKKKKKKKKKK’)
query = ‘lake ‘ + query[3:len(query)]
####print(‘COORD NOT FOUND FOR ‘ + query)
new_coordinates = get_coordinates(query)
lake_coordinates.append([stocking_data[i][0],float(new_coordinates[0]),float(new_coordinates[1]),0,new_coordinates[2]])
#print(lake_coordinates[j+1])
j = j + 1
i = i + 1
That gave correct answers for some 160 bodies of water (that I spot checked). It did have problems with just a few. Lakes like I-82 PD #4 and RADAR PD #1 didn’t geocode no matter how much I massaged the queries. I ended up looking those up manually from WDFW postings.
Once I had everything pulled, I hardcoded the coordinates in the script so it wouldn’t look it up each time. Google charges for API calls, and this will minimize how many are made. Now, new calls are made only if a new lake is entered, or I want to force it.
At this point I have a 2D array that looks something like this.
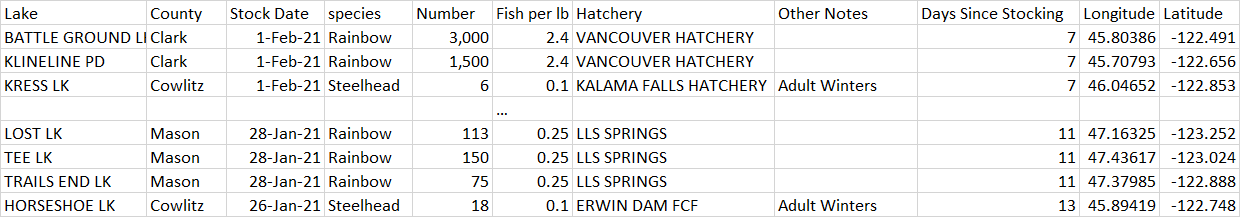
I’m scraping this year and least year, and it currently comes to about 1,200 items. That’s a lot of fish.
Decide how to format the data
So now I have a table that is formatted and ready to be parsed however I want to. How should I format it?
I knew I wanted to display it as points on a map. I have a little experience with that professionally in the GIS area, and KML files are often what I’ve seen. An alternative would be some sort of JSON or to play with the table directly in whatever map application I decided to go with.
I had already got a Google maps API going for the geocoding, so sticking with Google maps seemed like a good idea. I played around with many of the Google Maps JavaScript API examples they have collected. This example is a good introduction to markers, and this example is a good introduction to showing a KML.
It seems to me, if I handled all the points within the JavaScript I might be able to make the application a little more responsive then if I loaded KMLs – that would allow things like sliders or other UI elements. However, it might also make it somewhat heavy, and I want this map to be easy to use on small mobile devices. Additionally, I have thousands of hours of experience coding in python, and would probably measure my HTML/JavaScript writing in the hundreds of hours. If I wanted to get it out sooner than later, I should do most of the work on the python side. So, I decided to aim to show KMLs on the map.
I created a new API key for the mapping application – it will be visible in the HTML and so it is smart to lock it down to only be useable from a certain IP, domain, etc. I used a basic KML with some of the fishing data and got an idea as to the structure the data needed to be for the website. I knew I wanted to (1) be able to choose one or more fish to display (brown trout, cutthroat trout, rainbow trout, steelhead, tiger trout), and (2) be able to select how far back to display the data.
I played with overlapping KMLs on top of each other, but it got messy. So, I decided the map should display only one KML at a time. Given that there are five fish to display, that would mean the number of KMLs for each time that can be selected would be 2x2x2x2x2=32.
If my time range was limited to 6 or so options (7 days, 14 days, 30 days, 90 days, 180 days, 365 days), we are looking at 32×6=192 KML files. Though, 6 of those would be blank. That’s easily doable in python.
Formatting the data
I don’t want to hard code 192 options though. Additionally, it is important for file names to be predictable and consistent between the mapping application and whatever python will spit out. It needs to be exact. I decided to have python make the truth table for me.
#makes a binary table to use as a truth table for slecting fish specieis
def get_binary_table():
table = []
max_value = int(‘0b11111’,2)
binary_array_length = 5
i=0
while(i<int(‘0b11111’,2)+1):
input_no = str(format(i,’b’))
while(len(input_no)<binary_array_length):
input_no = ‘0’+input_no
table.append(input_no)
i=i+1
print(table)
return(table)
fish_to_run = [“Rainbow”,”Brown Trout”,”Cutthroat”,”Steelhead”,”Tiger Trout”]
fish_table = get_binary_table()
fish_run_table = []
i = 0
while(i<len(fish_table)):
this_run = []
if(fish_table[i][0]==’1′):
do = ‘nothing’
this_run.append(fish_to_run[0])
if(fish_table[i][1]==’1′):
do = ‘nothing’
this_run.append(fish_to_run[1])
if(fish_table[i][2]==’1′):
do = ‘nothing’
this_run.append(fish_to_run[2])
if(fish_table[i][3]==’1′):
do = ‘nothing’
this_run.append(fish_to_run[3])
if(fish_table[i][4]==’1′):
do = ‘nothing’
this_run.append(fish_to_run[4])
fish_run_table.append(this_run)
i = i + 1
print(fish_run_table)
That creates the binary table
00000
00001
00010
00011
00100
00101
00110
00111
01000
01001
01010
01011
01100
01101
01110
01111
10000
10001
10010
10011
10100
10101
10110
10111
11000
11001
11010
11011
11100
11101
11110
11111
Then the next loop creates an array of all the fish selection combinations (that was fun to type) by adding the fish name corresponding the position of the 1 or 0 of each element of the array. That will make it easy to add a fish or to re-use this code. The output ends up looking a little like this.
[]
[‘Tiger Trout’]
[‘Steelhead’]
[‘Steelhead’, ‘Tiger Trout’]
[‘Cutthroat’]
[‘Cutthroat’, ‘Tiger Trout’]
[‘Cutthroat’, ‘Steelhead’]
[‘Cutthroat’, ‘Steelhead’, ‘Tiger Trout’]
[‘Brown Trout’]
[‘Brown Trout’, ‘Tiger Trout’]
[‘Brown Trout’, ‘Steelhead’]
[‘Brown Trout’, ‘Steelhead’, ‘Tiger Trout’]
[‘Brown Trout’, ‘Cutthroat’]
[‘Brown Trout’, ‘Cutthroat’, ‘Tiger Trout’]
[‘Brown Trout’, ‘Cutthroat’, ‘Steelhead’]
[‘Brown Trout’, ‘Cutthroat’, ‘Steelhead’, ‘Tiger Trout’]
[‘Rainbow’]
[‘Rainbow’, ‘Tiger Trout’]
[‘Rainbow’, ‘Steelhead’]
[‘Rainbow’, ‘Steelhead’, ‘Tiger Trout’]
[‘Rainbow’, ‘Cutthroat’]
[‘Rainbow’, ‘Cutthroat’, ‘Tiger Trout’]
[‘Rainbow’, ‘Cutthroat’, ‘Steelhead’]
[‘Rainbow’, ‘Cutthroat’, ‘Steelhead’, ‘Tiger Trout’]
[‘Rainbow’, ‘Brown Trout’]
[‘Rainbow’, ‘Brown Trout’, ‘Tiger Trout’]
[‘Rainbow’, ‘Brown Trout’, ‘Steelhead’]
[‘Rainbow’, ‘Brown Trout’, ‘Steelhead’, ‘Tiger Trout’]
[‘Rainbow’, ‘Brown Trout’, ‘Cutthroat’]
[‘Rainbow’, ‘Brown Trout’, ‘Cutthroat’, ‘Tiger Trout’]
[‘Rainbow’, ‘Brown Trout’, ‘Cutthroat’, ‘Steelhead’]
[‘Rainbow’, ‘Brown Trout’, ‘Cutthroat’, ‘Steelhead’, ‘Tiger Trout’]
Ok. Now, to create one function I can reuse for all of the above combinations.
################################################
#export kml
def export_kml_with_variables(days,fish,filename):
#print(‘export_kml_with_variables(‘+str(days)+’,fish,’+filename+’)’)
kml_output = open(filename,”w”)
kml_output.write(KML_HEADER)
i = 1
while(i < len(stocking_data)):
j = 1
while(j < len(lake_coordinates)):
if(stocking_data[i][0] == lake_coordinates[j][0]):
k = 0
while(k < len(fish)):
age = stocking_data[i][8]
##print(age)
##print(days)
##print(fish[k])
##print(stocking_data[i][3])
if(fish[k] == stocking_data[i][3] and float(age) < float(float(days)+0.5)):
##print(“here”)
##print(‘age’)
##print(age)
##print(‘days’)
##print(days)
kml_output.write(”’
<Placemark>
<name>”’)
kml_output.write(lake_coordinates[j][4])
kml_output.write(”'</name>
<description>”’)
kml_output.write(str(stocking_data[0][1]) +”: “+str(stocking_data[i][1])+”<br />”)
kml_output.write(str(stocking_data[0][2]) +”: “+str(stocking_data[i][2])+”<br />”)
kml_output.write(str(stocking_data[0][3]) +”: “+str(stocking_data[i][3])+”<br />”)
kml_output.write(str(stocking_data[0][4]) +”: “+str(stocking_data[i][4])+”<br />”)
kml_output.write(str(stocking_data[0][5]) +”: “+str(stocking_data[i][5])+”<br />”)
kml_output.write(str(stocking_data[0][6]) +”: “+str(stocking_data[i][6])+”<br />”)
kml_output.write(str(stocking_data[0][7]) +”: “+str(stocking_data[i][7])+”<br />”)
lake_coordinates[j][3] = lake_coordinates[j][3] + 1
kml_output.write(”'</description>
<styleUrl>”’)
if(stocking_data[i][3] == ‘Rainbow’):
kml_output.write(‘#rainbow’)
elif(stocking_data[i][3] == ‘Brown Trout’):
kml_output.write(‘#brown_trout’)
elif(stocking_data[i][3] == ‘Cutthroat’):
kml_output.write(‘#cutthroat’)
elif(stocking_data[i][3] == ‘Steelhead’):
kml_output.write(‘#steelhead’)
elif(stocking_data[i][3] == ‘Tiger Trout’):
kml_output.write(‘#tiger_trout’)
else:
kml_output.write(‘#msn_ylw-pushpin’)
kml_output.write(”'</styleUrl>
<Point>
<coordinates>”’)
#kml_output.write(str(lake_coordinates[j][2]+(lake_coordinates[j][3])/1000)+”,”+str(lake_coordinates[j][1]))
kml_output.write(str(lake_coordinates[j][2])+”,”+str(lake_coordinates[j][1]))
kml_output.write(”'</coordinates>
</Point>
</Placemark>”’)
#j = 999
#i = 999
j = len(lake_coordinates)
k = k + 1
j = j + 1
i = i + 1
kml_output.write(”'</Document>
</kml>”’)
kml_output.close()
By passing how far back to look, the fish I want to see, and telling it the filename I want, I get a KML. This will give me every KML. The iteration variable is something I change manually when I need to to get around some caching issues while debugging.
i = 0
while(i<len(fish_run_table)):
export_kml_with_variables(7,fish_run_table[i],’7_days_’+get_fish_names_combined(fish_run_table[i])+’_stocking’+iteration+’.kml’)
export_kml_with_variables(14,fish_run_table[i],’14_days_’+get_fish_names_combined(fish_run_table[i])+’_stocking’+iteration+’.kml’)
export_kml_with_variables(30,fish_run_table[i],’30_days_’+get_fish_names_combined(fish_run_table[i])+’_stocking’+iteration+’.kml’)
export_kml_with_variables(90,fish_run_table[i],’90_days_’+get_fish_names_combined(fish_run_table[i])+’_stocking’+iteration+’.kml’)
export_kml_with_variables(180,fish_run_table[i],’180_days_’+get_fish_names_combined(fish_run_table[i])+’_stocking’+iteration+’.kml’)
export_kml_with_variables(365,fish_run_table[i],’365_days_’+get_fish_names_combined(fish_run_table[i])+’_stocking’+iteration+’.kml’)
Building the website
I bought a new domain, alarminghornet.com. I wanted to play with the HTML directly, and didn’t want to break anything on davidhartline.com. It has been a long time since I created a web page from scratch. I’ll skip over most of the CSS. Using the various examples at https://developers.google.com/maps/documentation/javascript/overview as inspiration, the code starts to look like this.
What KML is displayed is based on logic from the following variables declared in <head>
var map;
var ctaLayer;
var active_days_to_show_button = ‘show_90_days’;
var selected_color = ‘#7d1128’;
var unselected_color = ‘#c3b299’;
var button_text_color =’#ffffff’
var iteration = ‘8’; //needs to match the python script. For getting around maps cacheing wjhen needed
var show_cutthroat = true;
var show_steelhead = true;
var show_tiger_trout = true;
var show_rainbow = true;
var show_brown_trout = true;
var first_run = true;
Then we have the functions to initialize the map and load the KML based on the initial settings of the variables (all fish and 90 days). Also notice get_url_fish_names(), which generates the appropriate name for the KML file to display that corresponds to the python function export_kml_with_variables(days,fish,filename).
function initMap() {
map = new google.maps.Map(document.getElementById(‘map’), {
zoom: 7,
center: {lat: 47.390225, lng: -120.398316},
mapTypeId: ‘roadmap’
});
}
function update_map(){
var KML_url = ‘ERROR’
////window.alert(‘update_map() started ‘ +active_days_to_show_button);
////window.alert(‘show_brown_trout ‘+show_brown_trout+’ | show_cutthroat ‘+show_cutthroat+’ | show_rainbow ‘+show_rainbow+’ | show_steelhead ‘+show_steelhead+’ | show_tiger_trout ‘+show_tiger_trout)
if(active_days_to_show_button == ‘show_7_days’){
KML_url = ‘https://davidhartline.com/alarminghornet/’ + ‘7_days_’+ get_url_fish_names()+’_stocking’+iteration+’.kml’
} else if (active_days_to_show_button == ‘show_14_days’){
KML_url = ‘https://davidhartline.com/alarminghornet/’ + ’14_days_’+ get_url_fish_names()+’_stocking’+iteration+’.kml’
} else if (active_days_to_show_button == ‘show_30_days’){
KML_url = ‘https://davidhartline.com/alarminghornet/’ + ’30_days_’+ get_url_fish_names()+’_stocking’+iteration+’.kml’
} else if (active_days_to_show_button == ‘show_90_days’){
KML_url = ‘https://davidhartline.com/alarminghornet/’ + ’90_days_’+ get_url_fish_names()+’_stocking’+iteration+’.kml’
} else if (active_days_to_show_button == ‘show_180_days’){
KML_url = ‘https://davidhartline.com/alarminghornet/’ + ‘180_days_’+ get_url_fish_names()+’_stocking’+iteration+’.kml’
} else if (active_days_to_show_button == ‘show_365_days’){
KML_url = ‘https://davidhartline.com/alarminghornet/’ + ‘365_days_’+ get_url_fish_names()+’_stocking’+iteration+’.kml’
}
//window.alert(KML_url)
if(first_run == false){
ctaLayer.setMap(null);
}
ctaLayer = new google.maps.KmlLayer({
url: KML_url,
preserveViewport: true,
map: map,
});
first_run = false;
// Create the DIV to hold the control and call the CenterControl()
###INSERT CONTROL UI CODE HERE LATER
}
function get_url_fish_names(){
new_name = ”;
if(show_rainbow == true){
new_name = new_name +”Rainbow”;
}
if(show_brown_trout == true){
if(new_name != ”){
new_name = new_name +’_’;
}
new_name = new_name +”Brown_Trout”;
}
if(show_cutthroat == true){
if(new_name != ”){
new_name = new_name +’_’;
}
new_name = new_name +”Cutthroat”;
}
if(show_steelhead == true){
if(new_name != ”){
new_name = new_name +’_’;
}
new_name = new_name +”Steelhead”;
}
if(show_tiger_trout == true){
if(new_name != ”){
new_name = new_name +’_’;
}
new_name = new_name +”Tiger_Trout”;
}
return(new_name)
}
I tried a few different methods for the controls for the map. My first version used buttons placed in the body, but that left challenges related to responsive design. map.controls[google.maps.ControlPosition.LOCATION].push() ended up working great for me – allowing me to pop controls into the map itself. It starts to look like this.
function update_map(){
var KML_url = ‘ERROR’
////window.alert(‘update_map() started ‘ +active_days_to_show_button);
////window.alert(‘show_brown_trout ‘+show_brown_trout+’ | show_cutthroat ‘+show_cutthroat+’ | show_rainbow ‘+show_rainbow+’ | show_steelhead ‘+show_steelhead+’ | show_tiger_trout ‘+show_tiger_trout)
if(active_days_to_show_button == ‘show_7_days’){
KML_url = ‘https://davidhartline.com/alarminghornet/’ + ‘7_days_’+ get_url_fish_names()+’_stocking’+iteration+’.kml’
} else if (active_days_to_show_button == ‘show_14_days’){
KML_url = ‘https://davidhartline.com/alarminghornet/’ + ’14_days_’+ get_url_fish_names()+’_stocking’+iteration+’.kml’
} else if (active_days_to_show_button == ‘show_30_days’){
KML_url = ‘https://davidhartline.com/alarminghornet/’ + ’30_days_’+ get_url_fish_names()+’_stocking’+iteration+’.kml’
} else if (active_days_to_show_button == ‘show_90_days’){
KML_url = ‘https://davidhartline.com/alarminghornet/’ + ’90_days_’+ get_url_fish_names()+’_stocking’+iteration+’.kml’
} else if (active_days_to_show_button == ‘show_180_days’){
KML_url = ‘https://davidhartline.com/alarminghornet/’ + ‘180_days_’+ get_url_fish_names()+’_stocking’+iteration+’.kml’
} else if (active_days_to_show_button == ‘show_365_days’){
KML_url = ‘https://davidhartline.com/alarminghornet/’ + ‘365_days_’+ get_url_fish_names()+’_stocking’+iteration+’.kml’
}
//window.alert(KML_url)
if(first_run == false){
ctaLayer.setMap(null);
}
ctaLayer = new google.maps.KmlLayer({
url: KML_url,
preserveViewport: true,
map: map,
});
first_run = false;
// Create the DIV to hold the control and call the CenterControl()
// constructor passing in this DIV.
if(first_run == false){
map.controls[google.maps.ControlPosition.TOP_CENTER].clear();
map.controls[google.maps.ControlPosition.LEFT_CENTER].clear();
map.controls[google.maps.ControlPosition.BOTTOM_CENTER].clear();
}
const centerControlDiv = document.createElement(“div”);
CenterControl(centerControlDiv, map);
map.controls[google.maps.ControlPosition.TOP_CENTER].push(
centerControlDiv
);
const show_7_daysDiv = document.createElement(“div”);
show_7_days_control(show_7_daysDiv, map);
map.controls[google.maps.ControlPosition.TOP_CENTER].push(
show_7_daysDiv
);
const show_14_daysDiv = document.createElement(“div”);
show_14_days_control(show_14_daysDiv, map);
map.controls[google.maps.ControlPosition.TOP_CENTER].push(
show_14_daysDiv
);
const show_30_daysDiv = document.createElement(“div”);
show_30_days_control(show_30_daysDiv, map);
map.controls[google.maps.ControlPosition.TOP_CENTER].push(
show_30_daysDiv
);
const show_90_daysDiv = document.createElement(“div”);
show_90_days_control(show_90_daysDiv, map);
map.controls[google.maps.ControlPosition.TOP_CENTER].push(
show_90_daysDiv
);
const show_180_daysDiv = document.createElement(“div”);
show_180_days_control(show_180_daysDiv, map);
map.controls[google.maps.ControlPosition.TOP_CENTER].push(
show_180_daysDiv
);
const show_365_daysDiv = document.createElement(“div”);
show_365_days_control(show_365_daysDiv, map);
map.controls[google.maps.ControlPosition.TOP_CENTER].push(
show_365_daysDiv
);
const fish_label_button_Div = document.createElement(“div”);
fish_label_button_(fish_label_button_Div, map);
map.controls[google.maps.ControlPosition.LEFT_CENTER].push(
fish_label_button_Div
);
const add_or_remove_fish_brown_Div = document.createElement(“div”);
add_or_remove_fish_brown_(add_or_remove_fish_brown_Div, map);
map.controls[google.maps.ControlPosition.LEFT_CENTER].push(
add_or_remove_fish_brown_Div
);
const add_or_remove_fish_cutthroat_Div = document.createElement(“div”);
add_or_remove_fish_cutthroat_(add_or_remove_fish_cutthroat_Div, map);
map.controls[google.maps.ControlPosition.LEFT_CENTER].push(
add_or_remove_fish_cutthroat_Div
);
const add_or_remove_fish_rainbow_Div = document.createElement(“div”);
add_or_remove_fish_rainbow_(add_or_remove_fish_rainbow_Div, map);
map.controls[google.maps.ControlPosition.LEFT_CENTER].push(
add_or_remove_fish_rainbow_Div
);
const add_or_remove_fish_steelhead_Div = document.createElement(“div”);
add_or_remove_fish_steelhead_(add_or_remove_fish_steelhead_Div, map);
map.controls[google.maps.ControlPosition.LEFT_CENTER].push(
add_or_remove_fish_steelhead_Div
);
const add_or_remove_fish_tiger_trout_Div = document.createElement(“div”);
add_or_remove_fish_tiger_trout_(add_or_remove_fish_tiger_trout_Div, map);
map.controls[google.maps.ControlPosition.LEFT_CENTER].push(
add_or_remove_fish_tiger_trout_Div
);
const reset_map_button_Div = document.createElement(“div”);
reset_map_button_(reset_map_button_Div, map);
map.controls[google.maps.ControlPosition.BOTTOM_CENTER].push(
reset_map_button_Div
);
}
function CenterControl(controlDiv, map) {
// Set CSS for the control border.
const controlUI = document.createElement(“div”);
controlUI.style.backgroundColor = “#fff”;
controlUI.style.border = “1px solid #fff”;
controlUI.style.borderRadius = “3px”;
controlUI.style.boxShadow = “0 0px 0px rgba(0,0,0,.3)”;
controlUI.style.cursor = “pointer”;
controlUI.style.marginBottom = “22px”;
controlUI.style.textAlign = “center”;
controlUI.title = “How far back to show stocking data”;
controlDiv.appendChild(controlUI);
// Set CSS for the control interior.
const controlText = document.createElement(“div”);
controlText.style.color = “rgb(25,25,25)”;
controlText.style.fontFamily = “Roboto,Arial,sans-serif”;
controlText.style.fontSize = “16px”;
controlText.style.lineHeight = “38px”;
controlText.style.paddingLeft = “5px”;
controlText.style.paddingRight = “5px”;
controlText.innerHTML = “Stocking Data”;
controlUI.appendChild(controlText);
// Setup the click event listeners: simply set the map to Chicago.
controlUI.addEventListener(“click”, () => {
;
});
}
function show_7_days_control(controlDiv, map) {
// Set CSS for the control border.
const controlUI = document.createElement(“div”);
if(active_days_to_show_button == ‘show_7_days’){
bg_color = selected_color;
}else{
bg_color = unselected_color;
}
controlUI.style.backgroundColor = bg_color;//”#fff”;
controlUI.style.border = “1px solid #fff”;
controlUI.style.borderRadius = “3px”;
controlUI.style.boxShadow = “0 0px 0px rgba(0,0,0,.3)”;
controlUI.style.cursor = “pointer”;
controlUI.style.marginBottom = “22px”;
controlUI.style.textAlign = “center”;
controlUI.title = “Show the last 7 days of stocking data”;
controlDiv.appendChild(controlUI);
// Set CSS for the control interior.
const controlText = document.createElement(“div”);
controlText.style.color = button_text_color;
controlText.style.fontFamily = “Roboto,Arial,sans-serif”;
controlText.style.fontSize = “16px”;
controlText.style.lineHeight = “38px”;
controlText.style.paddingLeft = “5px”;
controlText.style.paddingRight = “5px”;
controlText.innerHTML = “7 days”;
controlUI.appendChild(controlText);
// Setup the click event listeners: simply set the map to Chicago.
controlUI.addEventListener(“click”, () => {
update_days(‘show_7_days’);
});
}
function show_14_days_control(controlDiv, map) {
// Set CSS for the control border.
const controlUI = document.createElement(“div”);
if(active_days_to_show_button == ‘show_14_days’){
bg_color = selected_color;
}else{
bg_color = unselected_color;
}
controlUI.style.backgroundColor = bg_color;//”#fff”;
controlUI.style.border = “1px solid #fff”;
controlUI.style.borderRadius = “3px”;
controlUI.style.boxShadow = “0 0px 0px rgba(0,0,0,.3)”;
controlUI.style.cursor = “pointer”;
controlUI.style.marginBottom = “22px”;
controlUI.style.textAlign = “center”;
controlUI.title = “Show the last 14 days of stocking data”;
controlDiv.appendChild(controlUI);
// Set CSS for the control interior.
const controlText = document.createElement(“div”);
controlText.style.color = button_text_color;
controlText.style.fontFamily = “Roboto,Arial,sans-serif”;
controlText.style.fontSize = “16px”;
controlText.style.lineHeight = “38px”;
controlText.style.paddingLeft = “5px”;
controlText.style.paddingRight = “5px”;
controlText.innerHTML = “14 days”;
controlUI.appendChild(controlText);
// Setup the click event listeners: simply set the map to Chicago.
controlUI.addEventListener(“click”, () => {
update_days(‘show_14_days’);
});
}
function show_30_days_control(controlDiv, map) {
// Set CSS for the control border.
const controlUI = document.createElement(“div”);
if(active_days_to_show_button == ‘show_30_days’){
bg_color = selected_color;
}else{
bg_color = unselected_color;
}
controlUI.style.backgroundColor = bg_color;//”#fff”;
controlUI.style.border = “1px solid #fff”;
controlUI.style.borderRadius = “3px”;
controlUI.style.boxShadow = “0 0px 0px rgba(0,0,0,.3)”;
controlUI.style.cursor = “pointer”;
controlUI.style.marginBottom = “22px”;
controlUI.style.textAlign = “center”;
controlUI.title = “Show the last 30 days of stocking data”;
controlDiv.appendChild(controlUI);
// Set CSS for the control interior.
const controlText = document.createElement(“div”);
controlText.style.color = button_text_color;
controlText.style.fontFamily = “Roboto,Arial,sans-serif”;
controlText.style.fontSize = “16px”;
controlText.style.lineHeight = “38px”;
controlText.style.paddingLeft = “5px”;
controlText.style.paddingRight = “5px”;
controlText.innerHTML = “30 days”;
controlUI.appendChild(controlText);
// Setup the click event listeners: simply set the map to Chicago.
controlUI.addEventListener(“click”, () => {
update_days(‘show_30_days’);
});
}
function show_90_days_control(controlDiv, map) {
// Set CSS for the control border.
const controlUI = document.createElement(“div”);
if(active_days_to_show_button == ‘show_90_days’){
bg_color = selected_color;
}else{
bg_color = unselected_color;
}
controlUI.style.backgroundColor = bg_color;//”#fff”;
controlUI.style.border = “1px solid #fff”;
controlUI.style.borderRadius = “3px”;
controlUI.style.boxShadow = “0 0px 0px rgba(0,0,0,.3)”;
controlUI.style.cursor = “pointer”;
controlUI.style.marginBottom = “22px”;
controlUI.style.textAlign = “center”;
controlUI.title = “Show the last 90 days of stocking data”;
controlDiv.appendChild(controlUI);
// Set CSS for the control interior.
const controlText = document.createElement(“div”);
controlText.style.color = button_text_color;
controlText.style.fontFamily = “Roboto,Arial,sans-serif”;
controlText.style.fontSize = “16px”;
controlText.style.lineHeight = “38px”;
controlText.style.paddingLeft = “5px”;
controlText.style.paddingRight = “5px”;
controlText.innerHTML = “90 days”;
controlUI.appendChild(controlText);
// Setup the click event listeners: simply set the map to Chicago.
controlUI.addEventListener(“click”, () => {
update_days(‘show_90_days’);
});
}
function show_180_days_control(controlDiv, map) {
// Set CSS for the control border.
const controlUI = document.createElement(“div”);
if(active_days_to_show_button == ‘show_180_days’){
bg_color = selected_color;
}else{
bg_color = unselected_color;
}
controlUI.style.backgroundColor = bg_color;//”#fff”;
controlUI.style.border = “1px solid #fff”;
controlUI.style.borderRadius = “3px”;
controlUI.style.boxShadow = “0 0px 0px rgba(0,0,0,.3)”;
controlUI.style.cursor = “pointer”;
controlUI.style.marginBottom = “22px”;
controlUI.style.textAlign = “center”;
controlUI.title = “Show the last 180 days of stocking data”;
controlDiv.appendChild(controlUI);
// Set CSS for the control interior.
const controlText = document.createElement(“div”);
controlText.style.color = button_text_color;
controlText.style.fontFamily = “Roboto,Arial,sans-serif”;
controlText.style.fontSize = “16px”;
controlText.style.lineHeight = “38px”;
controlText.style.paddingLeft = “5px”;
controlText.style.paddingRight = “5px”;
controlText.innerHTML = “180 days”;
controlUI.appendChild(controlText);
// Setup the click event listeners: simply set the map to Chicago.
controlUI.addEventListener(“click”, () => {
update_days(‘show_180_days’);
});
}
function show_365_days_control(controlDiv, map) {
// Set CSS for the control border.
const controlUI = document.createElement(“div”);
if(active_days_to_show_button == ‘show_365_days’){
bg_color = selected_color;
}else{
bg_color = unselected_color;
}
controlUI.style.backgroundColor = bg_color;//”#fff”;
controlUI.style.border = “1px solid #fff”;
controlUI.style.borderRadius = “3px”;
controlUI.style.boxShadow = “0 0px 0px rgba(0,0,0,.3)”;
controlUI.style.cursor = “pointer”;
controlUI.style.marginBottom = “22px”;
controlUI.style.textAlign = “center”;
controlUI.title = “Show the last 365 days of stocking data”;
controlDiv.appendChild(controlUI);
// Set CSS for the control interior.
const controlText = document.createElement(“div”);
controlText.style.color = button_text_color;
controlText.style.fontFamily = “Roboto,Arial,sans-serif”;
controlText.style.fontSize = “16px”;
controlText.style.lineHeight = “38px”;
controlText.style.paddingLeft = “5px”;
controlText.style.paddingRight = “5px”;
controlText.innerHTML = “365 days”;
controlUI.appendChild(controlText);
// Setup the click event listeners: simply set the map to Chicago.
controlUI.addEventListener(“click”, () => {
update_days(‘show_365_days’);
});
}
function fish_label_button_(controlDiv, map) {
// Set CSS for the control border.
const controlUI = document.createElement(“div”);
controlUI.style.backgroundColor = ‘white’;//”#fff”;
//controlUI.style.backgroundImage = “url(https://davidhartline.com/alarminghornet/brown_trout.png)”;
//controlUI.style.backgroundPosition = “bottom right”;
//controlUI.style.backgroundRepeat = “no-repeat”;
//controlUI.style.backgroundSize = “60px 30px”;
controlUI.style.height = ’50px’;
controlUI.style.width = ‘150px’;
controlUI.style.border = “1px solid #fff”;
controlUI.style.borderRadius = “3px”;
controlUI.style.boxShadow = “0 0px 0px rgba(0,0,0,.3)”;
controlUI.style.cursor = “pointer”;
controlUI.style.marginBottom = “0px”;
controlUI.style.textAlign = “center”;
controlUI.title = “Select the fish you want to show”;
controlDiv.appendChild(controlUI);
// Set CSS for the control interior.
const controlText = document.createElement(“div”);
controlText.style.color = ‘black’;
controlText.style.fontFamily = “Roboto,Arial,sans-serif”;
controlText.style.fontSize = “16px”;
controlText.style.lineHeight = “38px”;
controlText.style.paddingLeft = “5px”;
controlText.style.paddingRight = “5px”;
controlText.innerHTML = “Species Select”;
controlUI.appendChild(controlText);
// Setup the click event listeners: simply set the map to Chicago.
controlUI.addEventListener(“click”, () => {
;
});
}
function add_or_remove_fish_brown_(controlDiv, map) {
// Set CSS for the control border.
const controlUI = document.createElement(“div”);
if(show_brown_trout == true){
bg_color = selected_color;
}else{
bg_color = unselected_color;
}
controlUI.style.backgroundColor = bg_color;//”#fff”;
controlUI.style.backgroundImage = “url(https://davidhartline.com/alarminghornet/brown_trout.png)”;
controlUI.style.backgroundPosition = “bottom right”;
controlUI.style.backgroundRepeat = “no-repeat”;
controlUI.style.backgroundSize = “60px 30px”;
controlUI.style.height = ’50px’;
controlUI.style.width = ‘150px’;
controlUI.style.border = “1px solid #fff”;
controlUI.style.borderRadius = “3px”;
controlUI.style.boxShadow = “0 0px 0px rgba(0,0,0,.3)”;
controlUI.style.cursor = “pointer”;
controlUI.style.marginBottom = “0px”;
controlUI.style.textAlign = “left”;
controlUI.title = “Remove or add brown trout stocking from the map”;
controlDiv.appendChild(controlUI);
// Set CSS for the control interior.
const controlText = document.createElement(“div”);
controlText.style.color = button_text_color;
controlText.style.fontFamily = “Roboto,Arial,sans-serif”;
controlText.style.fontSize = “16px”;
controlText.style.lineHeight = “38px”;
controlText.style.paddingLeft = “5px”;
controlText.style.paddingRight = “5px”;
controlText.innerHTML = “Brown Trout”;
controlUI.appendChild(controlText);
// Setup the click event listeners: simply set the map to Chicago.
controlUI.addEventListener(“click”, () => {
add_or_remove_fish(‘Brown Trout’);
});
}
function add_or_remove_fish_cutthroat_(controlDiv, map) {
// Set CSS for the control border.
const controlUI = document.createElement(“div”);
if(show_cutthroat == true){
bg_color = selected_color;
}else{
bg_color = unselected_color;
}
controlUI.style.backgroundColor = bg_color;//”#fff”;
controlUI.style.backgroundImage = “url(https://davidhartline.com/alarminghornet/Cutthroat_button.png)”;
controlUI.style.backgroundPosition = “bottom right”;
controlUI.style.backgroundRepeat = “no-repeat”;
controlUI.style.backgroundSize = “60px 30px”;
controlUI.style.height = ’50px’;
controlUI.style.width = ‘150px’;
controlUI.style.border = “1px solid #fff”;
controlUI.style.borderRadius = “3px”;
controlUI.style.boxShadow = “0 0px 0px rgba(0,0,0,.3)”;
controlUI.style.cursor = “pointer”;
controlUI.style.marginBottom = “0px”;
controlUI.style.textAlign = “left”;
controlUI.title = “Remove or add cutthroat stocking from the map”;
controlDiv.appendChild(controlUI);
// Set CSS for the control interior.
const controlText = document.createElement(“div”);
controlText.style.color = button_text_color;
controlText.style.fontFamily = “Roboto,Arial,sans-serif”;
controlText.style.fontSize = “16px”;
controlText.style.lineHeight = “38px”;
controlText.style.paddingLeft = “5px”;
controlText.style.paddingRight = “5px”;
controlText.innerHTML = “Cutthroat”;
controlUI.appendChild(controlText);
// Setup the click event listeners: simply set the map to Chicago.
controlUI.addEventListener(“click”, () => {
add_or_remove_fish(‘Cutthroat’);
});
}
function add_or_remove_fish_rainbow_(controlDiv, map) {
// Set CSS for the control border.
const controlUI = document.createElement(“div”);
if(show_rainbow == true){
bg_color = selected_color;
}else{
bg_color = unselected_color;
}
controlUI.style.backgroundColor = bg_color;//”#fff”;
controlUI.style.backgroundImage = “url(https://davidhartline.com/alarminghornet/rainbow_button.png)”;
controlUI.style.backgroundPosition = “bottom right”;
controlUI.style.backgroundRepeat = “no-repeat”;
controlUI.style.backgroundSize = “60px 30px”;
controlUI.style.height = ’50px’;
controlUI.style.width = ‘150px’;
controlUI.style.border = “1px solid #fff”;
controlUI.style.borderRadius = “3px”;
controlUI.style.boxShadow = “0 0px 0px rgba(0,0,0,.3)”;
controlUI.style.cursor = “pointer”;
controlUI.style.marginBottom = “0px”;
controlUI.style.textAlign = “left”;
controlUI.title = “Remove or add rainbow stocking from the map”;
controlDiv.appendChild(controlUI);
// Set CSS for the control interior.
const controlText = document.createElement(“div”);
controlText.style.color = button_text_color;
controlText.style.fontFamily = “Roboto,Arial,sans-serif”;
controlText.style.fontSize = “16px”;
controlText.style.lineHeight = “38px”;
controlText.style.paddingLeft = “5px”;
controlText.style.paddingRight = “5px”;
controlText.innerHTML = “Rainbow”;
controlUI.appendChild(controlText);
// Setup the click event listeners: simply set the map to Chicago.
controlUI.addEventListener(“click”, () => {
add_or_remove_fish(‘Rainbow’);
});
}
function add_or_remove_fish_steelhead_(controlDiv, map) {
// Set CSS for the control border.
const controlUI = document.createElement(“div”);
if(show_steelhead == true){
bg_color = selected_color;
}else{
bg_color = unselected_color;
}
controlUI.style.backgroundColor = bg_color;//”#fff”;
controlUI.style.backgroundImage = “url(https://davidhartline.com/alarminghornet/steelhead_button.png)”;
controlUI.style.backgroundPosition = “bottom right”;
controlUI.style.backgroundRepeat = “no-repeat”;
controlUI.style.backgroundSize = “60px 30px”;
controlUI.style.height = ’50px’;
controlUI.style.width = ‘150px’;
controlUI.style.border = “1px solid #fff”;
controlUI.style.borderRadius = “3px”;
controlUI.style.boxShadow = “0 0px 0px rgba(0,0,0,.3)”;
controlUI.style.cursor = “pointer”;
controlUI.style.marginBottom = “0px”;
controlUI.style.textAlign = “left”;
controlUI.title = “Remove or add steelhead stocking from the map”;
controlDiv.appendChild(controlUI);
// Set CSS for the control interior.
const controlText = document.createElement(“div”);
controlText.style.color = button_text_color;
controlText.style.fontFamily = “Roboto,Arial,sans-serif”;
controlText.style.fontSize = “16px”;
controlText.style.lineHeight = “38px”;
controlText.style.paddingLeft = “5px”;
controlText.style.paddingRight = “5px”;
controlText.innerHTML = “Steelhead”;
controlUI.appendChild(controlText);
// Setup the click event listeners: simply set the map to Chicago.
controlUI.addEventListener(“click”, () => {
add_or_remove_fish(‘Steelhead’);
});
}
function add_or_remove_fish_tiger_trout_(controlDiv, map) {
// Set CSS for the control border.
const controlUI = document.createElement(“div”);
if(show_tiger_trout == true){
bg_color = selected_color;
}else{
bg_color = unselected_color;
}
controlUI.style.backgroundColor = bg_color;//”#fff”;
controlUI.style.backgroundImage = “url(https://davidhartline.com/alarminghornet/tiger_button.png)”;
controlUI.style.backgroundPosition = “bottom right”;
controlUI.style.backgroundRepeat = “no-repeat”;
controlUI.style.backgroundSize = “60px 30px”;
controlUI.style.height = ’50px’;
controlUI.style.width = ‘150px’;
controlUI.style.border = “1px solid #fff”;
controlUI.style.borderRadius = “3px”;
controlUI.style.boxShadow = “0 0px 0px rgba(0,0,0,.3)”;
controlUI.style.cursor = “pointer”;
controlUI.style.marginBottom = “0px”;
controlUI.style.textAlign = “left”;
controlUI.title = “Remove or add tiger trout stocking from the map”;
controlDiv.appendChild(controlUI);
// Set CSS for the control interior.
const controlText = document.createElement(“div”);
controlText.style.color = button_text_color;
controlText.style.fontFamily = “Roboto,Arial,sans-serif”;
controlText.style.fontSize = “16px”;
controlText.style.lineHeight = “38px”;
controlText.style.paddingLeft = “5px”;
controlText.style.paddingRight = “5px”;
controlText.innerHTML = “Tiger Trout”;
controlUI.appendChild(controlText);
// Setup the click event listeners: simply set the map to Chicago.
controlUI.addEventListener(“click”, () => {
add_or_remove_fish(‘Tiger Trout’);
});
}
function reset_map_button_(controlDiv, map) {
// Set CSS for the control border.
const controlUI = document.createElement(“div”);
controlUI.style.backgroundColor = unselected_color;
controlUI.style.border = “1px solid #fff”;
controlUI.style.borderRadius = “3px”;
controlUI.style.boxShadow = “0 0px 0px rgba(0,0,0,.3)”;
controlUI.style.cursor = “pointer”;
controlUI.style.marginBottom = “22px”;
controlUI.style.textAlign = “center”;
controlUI.title = “Reset the map”;
controlDiv.appendChild(controlUI);
// Set CSS for the control interior.
const controlText = document.createElement(“div”);
controlText.style.color = button_text_color;
controlText.style.fontFamily = “Roboto,Arial,sans-serif”;
controlText.style.fontSize = “16px”;
controlText.style.lineHeight = “38px”;
controlText.style.paddingLeft = “5px”;
controlText.style.paddingRight = “5px”;
controlText.innerHTML = “Reset Map”;
controlUI.appendChild(controlText);
// Setup the click event listeners: simply set the map to Chicago.
controlUI.addEventListener(“click”, () => {
reset_map();
});
}
I also build the markers and icons for the maps. They are also referenced in the KML files, so I updated the python script as well.


Automating the data scraping
I don’t want to manually scrape the WDFW data on a regular basis. And, scheduling a task on my personal PC seems clunky and unreliable. So, I spun up a Ubuntu server in AWS. From there, it is just a matter of installing the python packages needed, uploading the script and dependencies, and scheduling it to run using cron. The output files from the script, such as the KMLs, is uploaded by SFTP to my website where the URLs are referenced above. As of this writing it happens every hour and has been running smoothly for over a week.
I didn’t want to have to log in to the server to check to make sure things are running smoothly. I also wanted any end users to see how fresh the data is. I could then put it in the footer of the web page somewhat like this.
Last scrape of WDFW data: 02/10/2021 11:04 AM
Last update posted by WDFW: 02/01/2021
It first I modified the python script to output some timestamps to a txt file, then I tried to have the website import those timestamps as variables. That didn’t seem to work well. And, Chrome seemed to fight me on some cross site scripting stuff. In the end, I had the python script output an actual small HTML file that is then presented at the bottom of the map web page via iframe.
Summary
I had fun on this project. It gave me some ideas on what to try next. I’m happy to take feedback.