I want to make an interactive map, or maybe interactive charts, or both, that shows how hot fishing is in the the Puget Sound using creel reports – interviews of anglers – conducted by WDFW and posted at https://wdfw.wa.gov/fishing/reports/creel/puget. Google Maps JavaScript API looks like it will work again for the mapping, if I use it, and Chart.js looks like a good option for any interactive charts. I’ll probably stick with python in Ubuntu on AWS for the back end.
Get the back end data
Starting with the page for the last 60 days of creel reports at https://wdfw.wa.gov/fishing/reports/creel/puget?ramp=&sample_date=3&catch_area= I am able to extract the data with this code.
import requests
import bs4
import csv
from datetime import datetime
import time
#URL = ‘https://wdfw.wa.gov/fishing/reports/creel/puget’
URL2020 = ‘https://wdfw.wa.gov/fishing/reports/creel/puget-annual?sample_date=1&ramp=&catch_area=’
URL = ‘https://wdfw.wa.gov/fishing/reports/creel/puget?ramp=&sample_date=3&catch_area=’
URL = URL2020
r = requests.get(URL)
data = r.text
soup = bs4.BeautifulSoup(data, ‘lxml’)
results = soup.find(‘tbody’)
results = results.find_all(‘tr’)
results = soup.findAll(“div”, {“class”: “view-content”})
results = str(results)
#print(results)
creel_table = []
creel_table.append([‘Date’,’Ramp/Site’,’Catch area’,’# Interviews’,’Anglers’,’Chinook (per angler)’,’Chinook’,’Coho’,’Chum’,’Pink’,’Sockeye’,’Lingcod’,’Halibut’])
def extract_fish_reports(results,creel_table):
run = True
while(run == True):
results = results[results.find(‘<caption>’)+20:len(results)]
date = results[0:results.find(‘</caption>’)-13]
print(date)
results = results[results.find(‘<td class=”views-field views-field-location-name” headers=”view-location-name-table-column’):len(results)]
results = results[results.find(‘”>’)+2:len(results)]
ramp = results[0:results.find(‘</td>’)]
i = len(ramp) – 1
while(i>0):#remove ending spaces
if(ramp[i] == ‘ ‘):
i=i-1
else:
ramp = ramp[0:i+1]
i = 0
print(ramp)
results = results[results.find(‘<td class=”views-field views-field-catch-area-name” headers=”view-catch-area-name-table-column’)+90:len(results)]
results = results[results.find(‘”>’)+2:len(results)]
catch_area = results[0:results.find(‘</td>’)]
i = len(catch_area) – 1
while(i>0):#remove ending spaces
if(catch_area[i] == ‘ ‘):
i=i-1
else:
catch_area = catch_area[0:i+1]
i = 0
print(catch_area)
results = results[results.find(‘<td class=”views-field views-field-boats views-align-right” headers=”view-boats’)+90:len(results)]
results = results[results.find(‘”>’)+2:len(results)]
interviews = results[0:results.find(‘</td>’)]
i = len(interviews) – 1
while(i>0):#remove ending spaces
if(interviews[i] == ‘ ‘):
i=i-1
else:
interviews = interviews[0:i+1]
i = 0
print(interviews)
results = results[results.find(‘<td class=”views-field views-field-anglers views-align-right” headers=”view-anglers-table-column’)+90:len(results)]
results = results[results.find(‘”>’)+2:len(results)]
anglers = results[0:results.find(‘</td>’)]
i = len(anglers) – 1
while(i>0):#remove ending spaces
if(anglers[i] == ‘ ‘):
i=i-1
else:
anglers = anglers[0:i+1]
i = 0
print(anglers)
results = results[results.find(‘<td class=”views-field views-field-chinook-effort views-align-right” headers=”view-chinook’)+90:len(results)]
results = results[results.find(‘”>’)+2:len(results)]
chinook_pa = results[0:results.find(‘</td>’)]
i = len(chinook_pa) – 1
while(i>0):#remove ending spaces
if(chinook_pa[i] == ‘ ‘):
i=i-1
else:
chinook_pa = chinook_pa[0:i+1]
i = 0
print(chinook_pa)
results = results[results.find(‘<td class=”views-field views-field-chinook views-align-right” headers=”view-chinook-table-column-‘)+90:len(results)]
results = results[results.find(‘”>’)+2:len(results)]
chinook = results[0:results.find(‘</td>’)]
i = len(chinook) – 1
while(i>0):#remove ending spaces
if(chinook[i] == ‘ ‘):
i=i-1
else:
chinook = chinook[0:i+1]
i = 0
print(chinook)
results = results[results.find(‘<td class=”views-field views-field-coho views-align-right” headers=”view-coho-table-col’)+90:len(results)]
results = results[results.find(‘”>’)+2:len(results)]
coho = results[0:results.find(‘</td>’)]
i = len(coho) – 1
while(i>0):#remove ending spaces
if(coho[i] == ‘ ‘):
i=i-1
else:
coho = coho[0:i+1]
i = 0
print(coho)
results = results[results.find(‘<td class=”views-field views-field-chum views-align-right” headers=”view-chum-table-column’)+90:len(results)]
results = results[results.find(‘”>’)+2:len(results)]
chum = results[0:results.find(‘</td>’)]
i = len(chum) – 1
while(i>0):#remove ending spaces
if(chum[i] == ‘ ‘):
i=i-1
else:
chum = chum[0:i+1]
i = 0
print(chum)
results = results[results.find(‘<td class=”views-field views-field-pink views-align-right” headers=”view-pink-table-column-‘)+90:len(results)]
results = results[results.find(‘”>’)+2:len(results)]
pink = results[0:results.find(‘</td>’)]
i = len(pink) – 1
while(i>0):#remove ending spaces
if(pink[i] == ‘ ‘):
i=i-1
else:
pink = pink[0:i+1]
i = 0
print(pink)
results = results[results.find(‘<td class=”views-field views-field-sockeye views-align-right” headers=”view-sockeye-table-col’)+90:len(results)]
results = results[results.find(‘”>’)+2:len(results)]
sockeye = results[0:results.find(‘</td>’)]
i = len(sockeye) – 1
while(i>0):#remove ending spaces
if(sockeye[i] == ‘ ‘):
i=i-1
else:
sockeye = sockeye[0:i+1]
i = 0
print(sockeye)
results = results[results.find(‘<td class=”views-field views-field-lingcod views-align-right” headers=”view-lin’)+90:len(results)]
results = results[results.find(‘”>’)+2:len(results)]
lingcod = results[0:results.find(‘</td>’)]
i = len(lingcod) – 1
while(i>0):#remove ending spaces
if(lingcod[i] == ‘ ‘):
i=i-1
else:
lingcod = lingcod[0:i+1]
i = 0
print(lingcod)
results = results[results.find(‘<td class=”views-field views-field-halibut views-align-right” headers=”view-halibut-ta’)+90:len(results)]
results = results[results.find(‘”>’)+2:len(results)]
halibut = results[0:results.find(‘</td>’)]
i = len(halibut) – 1
while(i>0):#remove ending spaces
if(halibut[i] == ‘ ‘):
i=i-1
else:
halibut = halibut[0:i+1]
i = 0
print(halibut)
creel_table.append([date,ramp,catch_area,interviews,anglers,chinook_pa,chinook,coho,chum,pink,sockeye,lingcod,halibut])
if(results.find(‘<caption>’)>-1):
do = ‘nothing’
print(str(len(results))+’ characters remaining to process’)
else:
print(‘Process complete’)
run = False
return(creel_table)
creel_table = extract_fish_reports(results,creel_table)
i = 0
while(i<len(creel_table)):
print(creel_table[i])
i=i+1
Now to look at going farther back then 60 days. WDFW has the historic reports at https://wdfw.wa.gov/fishing/reports/creel/puget-annual
then, if I select a year an hit search, the URL becomeshttps://wdfw.wa.gov/fishing/reports/creel/puget-annual?sample_date=1&ramp=&catch_area=
The same code is able to successfully scrape that page. One problem, is that the page is broken down into multiple pages.

There may be URL parameter I could use like &all= that would give me all the results in one page. However, that feels weird ethically – I only want to access data anyone can by clicking on publicly available links. If I start ‘hacking’ the URL that may cross a line.
I could probably write something that sees the page numbers at the bottom and crawls through it.
An even easier option for this dataset is I see they have posted csv files. While they don’t have them for recent reports, they have them conveniently for past years. It seems recent reports are subject to revision and they don’t provide those as csvs.
The Download CSV link on the 2020 page goes to https://wdfw.wa.gov/fishing/reports/creel/puget-annual/export?sample_date=1&ramp=&catch_area=&page&_format=csv
The CSV format looks good. Let’s see if I can pull the CSV for 2020 into my python script, then grab further years.
Got it. This grabs 2020 – 2013. Given the URL format I think it well grab 2021-2014 when the year rolls over without needing to modify the code.
URL = ‘https://wdfw.wa.gov/fishing/reports/creel/puget?ramp=&sample_date=3&catch_area=’
r = requests.get(URL)
data = r.text
soup = bs4.BeautifulSoup(data, ‘lxml’)
results = soup.find(‘tbody’)
results = results.find_all(‘tr’)
results = soup.findAll(“div”, {“class”: “view-content”})
results = str(results)
###print(results)
creel_table = []
creel_table.append([‘Date’,’Ramp/Site’,’Catch area’,’# Interviews’,’Anglers’,’Chinook (per angler)’,’Chinook’,’Coho’,’Chum’,’Pink’,’Sockeye’,’Lingcod’,’Halibut’])
def extract_fish_reports(results,creel_table):
run = True
while(run == True):
results = results[results.find(‘<caption>’)+20:len(results)]
date = results[0:results.find(‘</caption>’)-13]
##print(date)
results = results[results.find(‘<td class=”views-field views-field-location-name” headers=”view-location-name-table-column’):len(results)]
results = results[results.find(‘”>’)+2:len(results)]
ramp = results[0:results.find(‘</td>’)]
i = len(ramp) – 1
while(i>0):#remove ending spaces
if(ramp[i] == ‘ ‘):
i=i-1
else:
ramp = ramp[0:i+1]
i = 0
##print(ramp)
results = results[results.find(‘<td class=”views-field views-field-catch-area-name” headers=”view-catch-area-name-table-column’)+90:len(results)]
results = results[results.find(‘”>’)+2:len(results)]
catch_area = results[0:results.find(‘</td>’)]
i = len(catch_area) – 1
while(i>0):#remove ending spaces
if(catch_area[i] == ‘ ‘):
i=i-1
else:
catch_area = catch_area[0:i+1]
i = 0
##print(catch_area)
results = results[results.find(‘<td class=”views-field views-field-boats views-align-right” headers=”view-boats’)+90:len(results)]
results = results[results.find(‘”>’)+2:len(results)]
interviews = results[0:results.find(‘</td>’)]
i = len(interviews) – 1
while(i>0):#remove ending spaces
if(interviews[i] == ‘ ‘):
i=i-1
else:
interviews = interviews[0:i+1]
i = 0
##print(interviews)
results = results[results.find(‘<td class=”views-field views-field-anglers views-align-right” headers=”view-anglers-table-column’)+90:len(results)]
results = results[results.find(‘”>’)+2:len(results)]
anglers = results[0:results.find(‘</td>’)]
i = len(anglers) – 1
while(i>0):#remove ending spaces
if(anglers[i] == ‘ ‘):
i=i-1
else:
anglers = anglers[0:i+1]
i = 0
##print(anglers)
results = results[results.find(‘<td class=”views-field views-field-chinook-effort views-align-right” headers=”view-chinook’)+90:len(results)]
results = results[results.find(‘”>’)+2:len(results)]
chinook_pa = results[0:results.find(‘</td>’)]
i = len(chinook_pa) – 1
while(i>0):#remove ending spaces
if(chinook_pa[i] == ‘ ‘):
i=i-1
else:
chinook_pa = chinook_pa[0:i+1]
i = 0
##print(chinook_pa)
results = results[results.find(‘<td class=”views-field views-field-chinook views-align-right” headers=”view-chinook-table-column-‘)+90:len(results)]
results = results[results.find(‘”>’)+2:len(results)]
chinook = results[0:results.find(‘</td>’)]
i = len(chinook) – 1
while(i>0):#remove ending spaces
if(chinook[i] == ‘ ‘):
i=i-1
else:
chinook = chinook[0:i+1]
i = 0
##print(chinook)
results = results[results.find(‘<td class=”views-field views-field-coho views-align-right” headers=”view-coho-table-col’)+90:len(results)]
results = results[results.find(‘”>’)+2:len(results)]
coho = results[0:results.find(‘</td>’)]
i = len(coho) – 1
while(i>0):#remove ending spaces
if(coho[i] == ‘ ‘):
i=i-1
else:
coho = coho[0:i+1]
i = 0
##print(coho)
results = results[results.find(‘<td class=”views-field views-field-chum views-align-right” headers=”view-chum-table-column’)+90:len(results)]
results = results[results.find(‘”>’)+2:len(results)]
chum = results[0:results.find(‘</td>’)]
i = len(chum) – 1
while(i>0):#remove ending spaces
if(chum[i] == ‘ ‘):
i=i-1
else:
chum = chum[0:i+1]
i = 0
##print(chum)
results = results[results.find(‘<td class=”views-field views-field-pink views-align-right” headers=”view-pink-table-column-‘)+90:len(results)]
results = results[results.find(‘”>’)+2:len(results)]
pink = results[0:results.find(‘</td>’)]
i = len(pink) – 1
while(i>0):#remove ending spaces
if(pink[i] == ‘ ‘):
i=i-1
else:
pink = pink[0:i+1]
i = 0
##print(pink)
results = results[results.find(‘<td class=”views-field views-field-sockeye views-align-right” headers=”view-sockeye-table-col’)+90:len(results)]
results = results[results.find(‘”>’)+2:len(results)]
sockeye = results[0:results.find(‘</td>’)]
i = len(sockeye) – 1
while(i>0):#remove ending spaces
if(sockeye[i] == ‘ ‘):
i=i-1
else:
sockeye = sockeye[0:i+1]
i = 0
##print(sockeye)
results = results[results.find(‘<td class=”views-field views-field-lingcod views-align-right” headers=”view-lin’)+90:len(results)]
results = results[results.find(‘”>’)+2:len(results)]
lingcod = results[0:results.find(‘</td>’)]
i = len(lingcod) – 1
while(i>0):#remove ending spaces
if(lingcod[i] == ‘ ‘):
i=i-1
else:
lingcod = lingcod[0:i+1]
i = 0
##print(lingcod)
results = results[results.find(‘<td class=”views-field views-field-halibut views-align-right” headers=”view-halibut-ta’)+90:len(results)]
results = results[results.find(‘”>’)+2:len(results)]
halibut = results[0:results.find(‘</td>’)]
i = len(halibut) – 1
while(i>0):#remove ending spaces
if(halibut[i] == ‘ ‘):
i=i-1
else:
halibut = halibut[0:i+1]
i = 0
##print(halibut)
creel_table.append([date,ramp,catch_area,interviews,anglers,chinook_pa,chinook,coho,chum,pink,sockeye,lingcod,halibut])
if(results.find(‘<caption>’)>-1):
do = ‘nothing’
##print(str(len(results))+’ characters remaining to process’)
else:
##print(‘Process complete’)
run = False
return(creel_table)
i = 0
while(i<len(creel_table)):
##print(creel_table[i])
do = ‘nothing’
i=i+1
def remove_trailing_spaces(string):
##print(‘sring start ‘+string+’.’)
i = len(string) – 1
while(i>0):#remove ending spaces
if(string[i] == ‘ ‘):
i=i-1
else:
string = string[0:i+1]
i = 0
##print(‘string end ‘+string+’.’)
return(string)
def export_as_csv(filename,data):
print(‘..exporting…’)
with open(filename, ‘w’, newline=”) as csvfile2:
spamwriter = csv.writer(csvfile2, delimiter=’,’,
quotechar='”‘, quoting=csv.QUOTE_MINIMAL)
for row in data:
spamwriter.writerow(row)
def add_fish_from_csv_url(url,dataname,creel_table):
USE_CACHE = False #dont want to access WDFW data too much, use previously downloaded files most of the time
print(‘Current number of records: ‘+str(len(creel_table)))
if(USE_CACHE == True):
print(‘Downloading ‘+dataname+’ from ‘+url)
r = requests.get(url)
with open(str(dataname+’.csv’), ‘wb’) as f:
f.write(r.content)
else:
print(‘Retreiving previously downloaded data from ‘+dataname+’.csv’)
do = ‘nothing’ #
with open(str(dataname+’.csv’)) as csvfile:
readCSV = csv.reader(csvfile, delimiter=’,’)
i=0
for row in readCSV:
if(i != 0): #ignore header
date = remove_trailing_spaces(row[0])
ramp = remove_trailing_spaces(row[1])
catch_area = remove_trailing_spaces(row[2])
interviews = remove_trailing_spaces(row[3])
anglers = remove_trailing_spaces(row[4])
chinook_pa = remove_trailing_spaces(row[5])
chinook = remove_trailing_spaces(row[6])
coho = remove_trailing_spaces(row[7])
chum = remove_trailing_spaces(row[8])
pink = remove_trailing_spaces(row[9])
sockeye = remove_trailing_spaces(row[10])
lingcod = remove_trailing_spaces(row[11])
halibut = remove_trailing_spaces(row[12])
#print(‘ ‘ + row)
creel_table.append([date,ramp,catch_area,interviews,anglers,chinook_pa,chinook,coho,chum,pink,sockeye,lingcod,halibut])
i+=1
print(‘New number of records: ‘+str(len(creel_table)))
print(‘________’)
return(creel_table)
URLYearMinus1 = ‘https://wdfw.wa.gov/fishing/reports/creel/puget-annual/export?page&_format=csv’
URLYearMinus2 = ‘https://wdfw.wa.gov/fishing/reports/creel/puget-annual/export?sample_date=2&ramp=&catch_area=&page&_format=csv’
URLYearMinus3 = ‘https://wdfw.wa.gov/fishing/reports/creel/puget-annual/export?sample_date=3&ramp=&catch_area=&page&_format=csv’
URLYearMinus4 = ‘https://wdfw.wa.gov/fishing/reports/creel/puget-annual/export?sample_date=4&ramp=&catch_area=&page&_format=csv’
URLYearMinus5 = ‘https://wdfw.wa.gov/fishing/reports/creel/puget-annual/export?sample_date=5&ramp=&catch_area=&page&_format=csv’
URLYearMinus6 = ‘https://wdfw.wa.gov/fishing/reports/creel/puget-annual/export?sample_date=6&ramp=&catch_area=&page&_format=csv’
URLYearMinus7 = ‘https://wdfw.wa.gov/fishing/reports/creel/puget-annual/export?sample_date=7&ramp=&catch_area=&page&_format=csv’
URLYearMinus8 = ‘https://wdfw.wa.gov/fishing/reports/creel/puget-annual/export?sample_date=8&ramp=&catch_area=&page&_format=csv’
creel_table = extract_fish_reports(results,creel_table)
creel_table = add_fish_from_csv_url(URLYearMinus1,’CREELYearMinus1′,creel_table)
creel_table = add_fish_from_csv_url(URLYearMinus2,’CREELYearMinus2′,creel_table)
creel_table = add_fish_from_csv_url(URLYearMinus3,’CREELYearMinus3′,creel_table)
creel_table = add_fish_from_csv_url(URLYearMinus4,’CREELYearMinus4′,creel_table)
creel_table = add_fish_from_csv_url(URLYearMinus5,’CREELYearMinus5′,creel_table)
creel_table = add_fish_from_csv_url(URLYearMinus6,’CREELYearMinus6′,creel_table)
creel_table = add_fish_from_csv_url(URLYearMinus7,’CREELYearMinus7′,creel_table)
creel_table = add_fish_from_csv_url(URLYearMinus8 ,’CREELYearMinus8′,creel_table)
#print the table
i = 0
print_end = i + 10
print(‘Printing the first ‘+str(print_end -i)+’ rows of creel_table’)
while(i<print_end):
print(creel_table[i])
do = ‘nothing’
i=i+1
> python creel_import6.py
Current number of records: 21
Retreiving previously downloaded data from CREELYearMinus1.csv
New number of records: 3493
________
Current number of records: 3493
Retreiving previously downloaded data from CREELYearMinus2.csv
New number of records: 7678
________
Current number of records: 7678
Retreiving previously downloaded data from CREELYearMinus3.csv
New number of records: 12261
________
Current number of records: 12261
Retreiving previously downloaded data from CREELYearMinus4.csv
New number of records: 16086
________
Current number of records: 16086
Retreiving previously downloaded data from CREELYearMinus5.csv
New number of records: 18662
________
Current number of records: 18662
Retreiving previously downloaded data from CREELYearMinus6.csv
New number of records: 21690
________
Current number of records: 21690
Retreiving previously downloaded data from CREELYearMinus7.csv
New number of records: 24555
________
Current number of records: 24555
Retreiving previously downloaded data from CREELYearMinus8.csv
New number of records: 27750
________
Printing the first 10 rows of creel_table
[‘Date’, ‘Ramp/Site’, ‘Catch area’, ‘# Interviews’, ‘Anglers’, ‘Chinook (per angler)’, ‘Chinook’, ‘Coho’, ‘Chum’, ‘Pink’, ‘Sockeye’, ‘Lingcod’, ‘Halibut’]
[‘Feb 10, 2021’, ‘Gig Harbor Ramp’, ‘Area 13, South Puget Sound’, ‘1 ‘, ‘3 ‘, ‘0 ‘, ‘0 ‘, ‘0 ‘, ‘0 ‘, ‘0 ‘, ‘0 ‘, ‘0 ‘, ‘0 ‘]
[‘Feb 8, 2021’, ‘Everett Ramp (formerly Norton Street Ramp (2010))’, ‘Area 8-2, Ports Susan and Gardner’, ‘2 ‘, ‘7 ‘, ‘0 ‘, ‘0 ‘, ‘0 ‘, ‘0 ‘, ‘0 ‘, ‘0 ‘, ‘0 ‘, ‘0 ‘]
[‘Feb 7, 2021’, ‘Manchester Public Ramp’, ‘Area 10, Seattle-Bremerton area’, ‘2 ‘, ‘5 ‘, ‘0 ‘, ‘0 ‘, ‘0 ‘, ‘0 ‘, ‘0 ‘, ‘0 ‘, ‘0 ‘, ‘0 ‘]
[‘Feb 6, 2021’, ‘Luhr Beach Ramp’, ‘Area 13, South Puget Sound’, ‘1 ‘, ‘3 ‘, ‘0.67’, ‘2 ‘, ‘1 ‘, ‘0 ‘, ‘0 ‘, ‘0 ‘, ‘0 ‘, ‘0 ‘]
[‘Feb 5, 2021’, “Hartstene Is. Ramp (aka Latimer’s Landing)”, ‘Area 13, South Puget Sound’, ‘2 ‘, ‘2 ‘, ‘0 ‘, ‘0 ‘, ‘0 ‘, ‘0 ‘, ‘0 ‘, ‘0 ‘, ‘0 ‘, ‘0 ‘]
[‘Feb 3, 2021’, ‘Luhr Beach Ramp’, ‘Area 13, South Puget Sound’, ‘1 ‘, ‘1 ‘, ‘0 ‘, ‘0 ‘, ‘0 ‘, ‘0 ‘, ‘0 ‘, ‘0 ‘, ‘0 ‘, ‘0 ‘]
[‘Jan 31, 2021’, “Hartstene Is. Ramp (aka Latimer’s Landing)”, ‘Area 13, South Puget Sound’, ‘1 ‘, ‘1 ‘, ‘0 ‘, ‘0 ‘, ‘1 ‘, ‘0 ‘, ‘0 ‘, ‘0 ‘, ‘0 ‘, ‘0 ‘]
[‘Jan 30, 2021’, ‘Point Defiance Public Ramp’, ‘Area 11, Tacoma-Vashon Island’, ‘1 ‘, ‘5 ‘, ‘0 ‘, ‘0 ‘, ‘0 ‘, ‘0 ‘, ‘0 ‘, ‘0 ‘, ‘0 ‘, ‘0 ‘]
[‘Jan 29, 2021’, ‘Cornet Bay Public Ramp’, ‘Area 6, East Juan de Fuca Strait’, ‘1 ‘, ‘3 ‘, ‘0 ‘, ‘0 ‘, ‘0 ‘, ‘0 ‘, ‘0 ‘, ‘0 ‘, ‘0 ‘, ‘0 ‘]
Seems to be working well. I’ve also added the ability to use the previously downloaded CSV data. No sense in throwing requests at WDFW for no reason.
So, how does the data actually look now that I have it in a way I can work with? I added this to the script to collect data on each fish for every month for all the past years (to 2013). At first I was going to drill it down by fishing region or something, but I want to see how the aggregate looks first.
#zone_to_check = ‘Area 13, South Puget Sound’
#area_array = area_13_coho
i=1#skip header
while(i<len(creel_table)):
if(1==1):
#if(creel_table[i][2] == zone_to_check): #might ddo this later
j = 1 #skip label
while(j<len(area_array[0])):
if(area_array[0][j] == creel_table[i][0][0:3]): ##corrct month
#anglers
area_array[1][j] = area_array[1][j] + float(remove_commas(creel_table[i][4]))
#chinook
fish_row = 2
fish_column = 6
area_array[fish_row][j] = area_array[fish_row][j] + float(remove_commas(creel_table[i][fish_column]))
if(area_array[1][j] != 0):
area_array[fish_row+1][j] = area_array[fish_row][j]/area_array[1][j]
#coho
fish_row = 4
fish_column = 7
area_array[fish_row][j] = area_array[fish_row][j] + float(remove_commas(creel_table[i][fish_column]))
if(area_array[1][j] != 0):
area_array[fish_row+1][j] = area_array[fish_row][j]/area_array[1][j]
#chum
fish_row = 6
fish_column = 8
area_array[fish_row][j] = area_array[fish_row][j] + float(remove_commas(creel_table[i][fish_column]))
if(area_array[1][j] != 0):
area_array[fish_row+1][j] = area_array[fish_row][j]/area_array[1][j]
#pink
fish_row = 8
fish_column = 9
area_array[fish_row][j] = area_array[fish_row][j] + float(remove_commas(creel_table[i][fish_column]))
if(area_array[1][j] != 0):
area_array[fish_row+1][j] = area_array[fish_row][j]/area_array[1][j]
#sockeye
fish_row = 10
fish_column = 10
area_array[fish_row][j] = area_array[fish_row][j] + float(remove_commas(creel_table[i][fish_column]))
if(area_array[1][j] != 0):
area_array[fish_row+1][j] = area_array[fish_row][j]/area_array[1][j]
#lingcod
fish_row = 12
fish_column = 11
area_array[fish_row][j] = area_array[fish_row][j] + float(remove_commas(creel_table[i][fish_column]))
if(area_array[1][j] != 0):
area_array[fish_row+1][j] = area_array[fish_row][j]/area_array[1][j]
#halibut
fish_row = 14
fish_column = 12
area_array[fish_row][j] = area_array[fish_row][j] + float(remove_commas(creel_table[i][fish_column]))
if(area_array[1][j] != 0):
area_array[fish_row+1][j] = area_array[fish_row][j]/area_array[1][j]
##print(creel_table[i][0][0:2])
j=j+1
i=i+1
#save our data for debugging, etc
with open(“creel_export.csv”,”w”,newline=”) as csvfile:
spamwriter = csv.writer(csvfile, delimiter=’,’)
i = 0
while(i<len(area_13_coho)):
row = area_13_coho[i]
spamwriter.writerow(row)
i=i+1
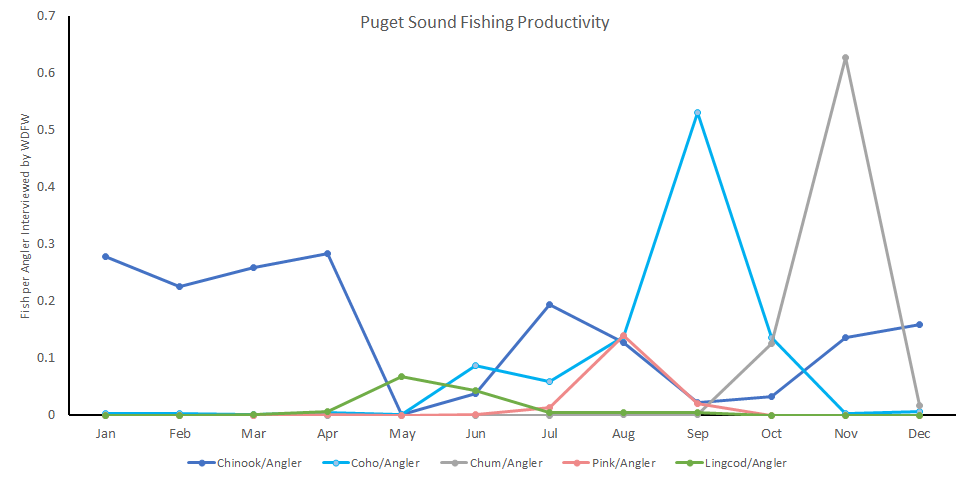
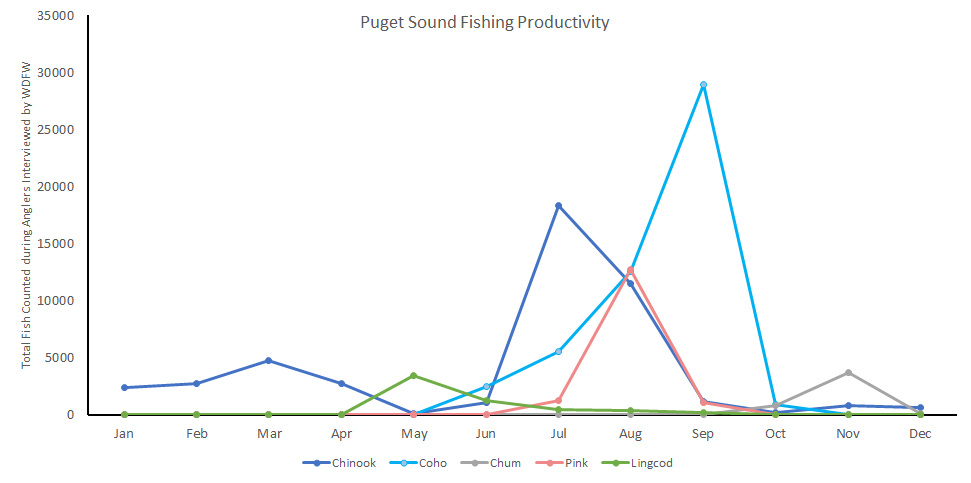
Let’s open the CSV in excel quick and do some sanity checking with graphs.


It didn’t appear obviously wrong to me, but I am historically a freshwater fisherman. I’ve only been fishing the sound since 2019. So I asked some local fishing groups on facebook.
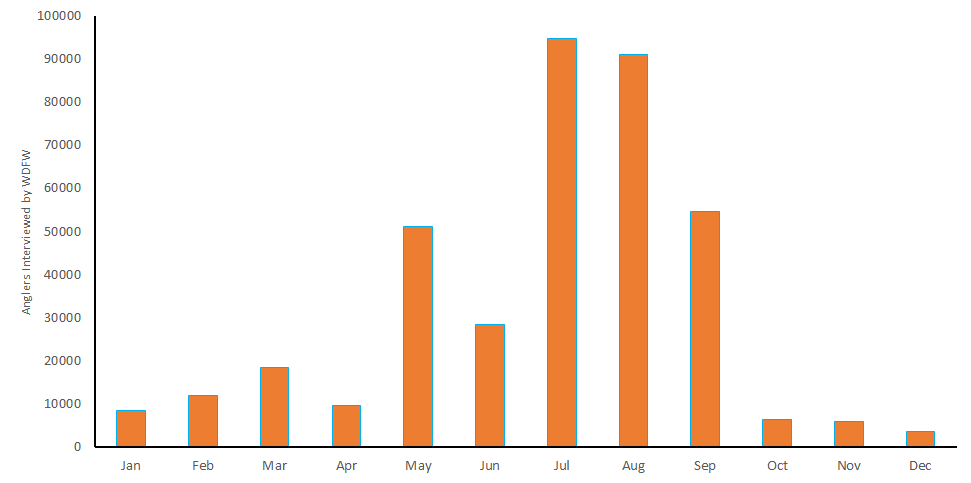
The consensus was the trends looked accurate. There was some surprise by how few fisherman actually returned with fish. There was also notes to ensure it is clear that WDFW does not do random sampling, they may check more during times of the year or at locations for various reasons. Additionally, if there is no-one to interview it isn’t shown in the data.
We can look at the amount of anglers interviewed.

I think the best way to minimize the variation in interview frequency and location is simply to divide by the number of interviews. For the two charts above, that would mean focusing on the first one. But at least we know this data appears good.
How to get the data for the Charts.js implementation?
The python script is ready to output data however I want to tell it. I can think of a few options;
Multiple smaller static datasets. In my Interactive Stocking Reports build, I had the script upload 100 some data files to a webserver, then had the website grab whatever datafile was needed based on a naming structure. This could work, but I think the amount of small datasets we will need will be prohibitively large.
Use one large static dataset. Maybe. I would have to get much better at JavaScript. Also, the current size of the 7 years of CSVs is over 2 MB. I imagine that will grow as we add additional analysis. That might slow things down. Though, it seems that 2 MB would not be abnormal.
Set up an API. I would call the API which would do manipulation server side, and give the response to the browser. That would allow me to do most of the coding in python and keep the page small. I’ve worked with REST API a lot, but never done the server side. It could be a good experience and it looks like here is a good starting place.
I want to get to know Charts.js better before deciding on a direction. The official examples are good looking charts, but they all have hard coded data. I found a great writeup, The Many Ways of Getting Data Into Charts, that has a nice section for REST API. It also mentions static tables and Google spreadsheets, which aren’t useful for this data. Visualizing CSV data with Chart.js shows a CSV example. I think I’ll start there.
Well, I’m facing an issue with CORS policy again. I had a challenge with this in my last project that I was able to work around with an iFrame. That might not work this time. Whether I put the file locally or on the web, I can’t even get a basic chart of the data going. It would probably work if I actually uploaded it, but that would really slow development.

There is a good writeup about the warning on stackexchange, it would seem my options include (1) setting up a proxy, (2) adding padding, or (3) setting up an API; flask looks promising.